Dashboard
최신 업데이트:2026-01-06 18:17:44
Enable the dashboard feature to allow users to flexibly configure and fulfill personalized business monitoring requirements.
With this feature, users can precisely customize and track key traffic and performance metrics for websites or APIs, gaining in-depth business insights. The platform’s native data is pushed to the log service platform, enabling users to build customized alert policies based on these metrics (for example, monitoring traffic originating from specific countries or regions). This allows users to monitor business status in real time, quickly identify and respond to potential issues, and ensure business continuity and stability.
You can specify the target Domain (only supported for platform native data), select log fields, define log format, and achieve accurate data visualization and analysis.
Below are detailed instructions on how to enable the dashboard feature.
Procedure
-
Go to the Log Service Platform.
-
Click the Log Library in the navigation bar.
-
On the Log Library List page, select the desired log and click the
 button on the right to enter the data consumption page.
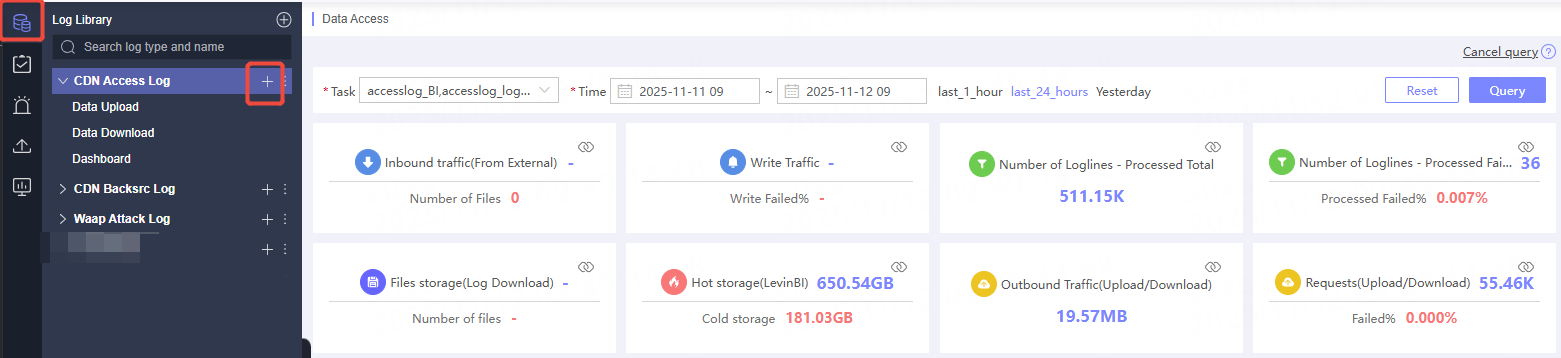
-
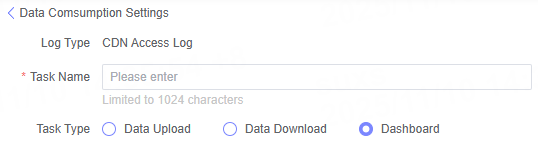
On the Create Data Consumption page, select the Dashboard consumption type.
Dashboard Operation Guide
Step 1: Select Product/Domain
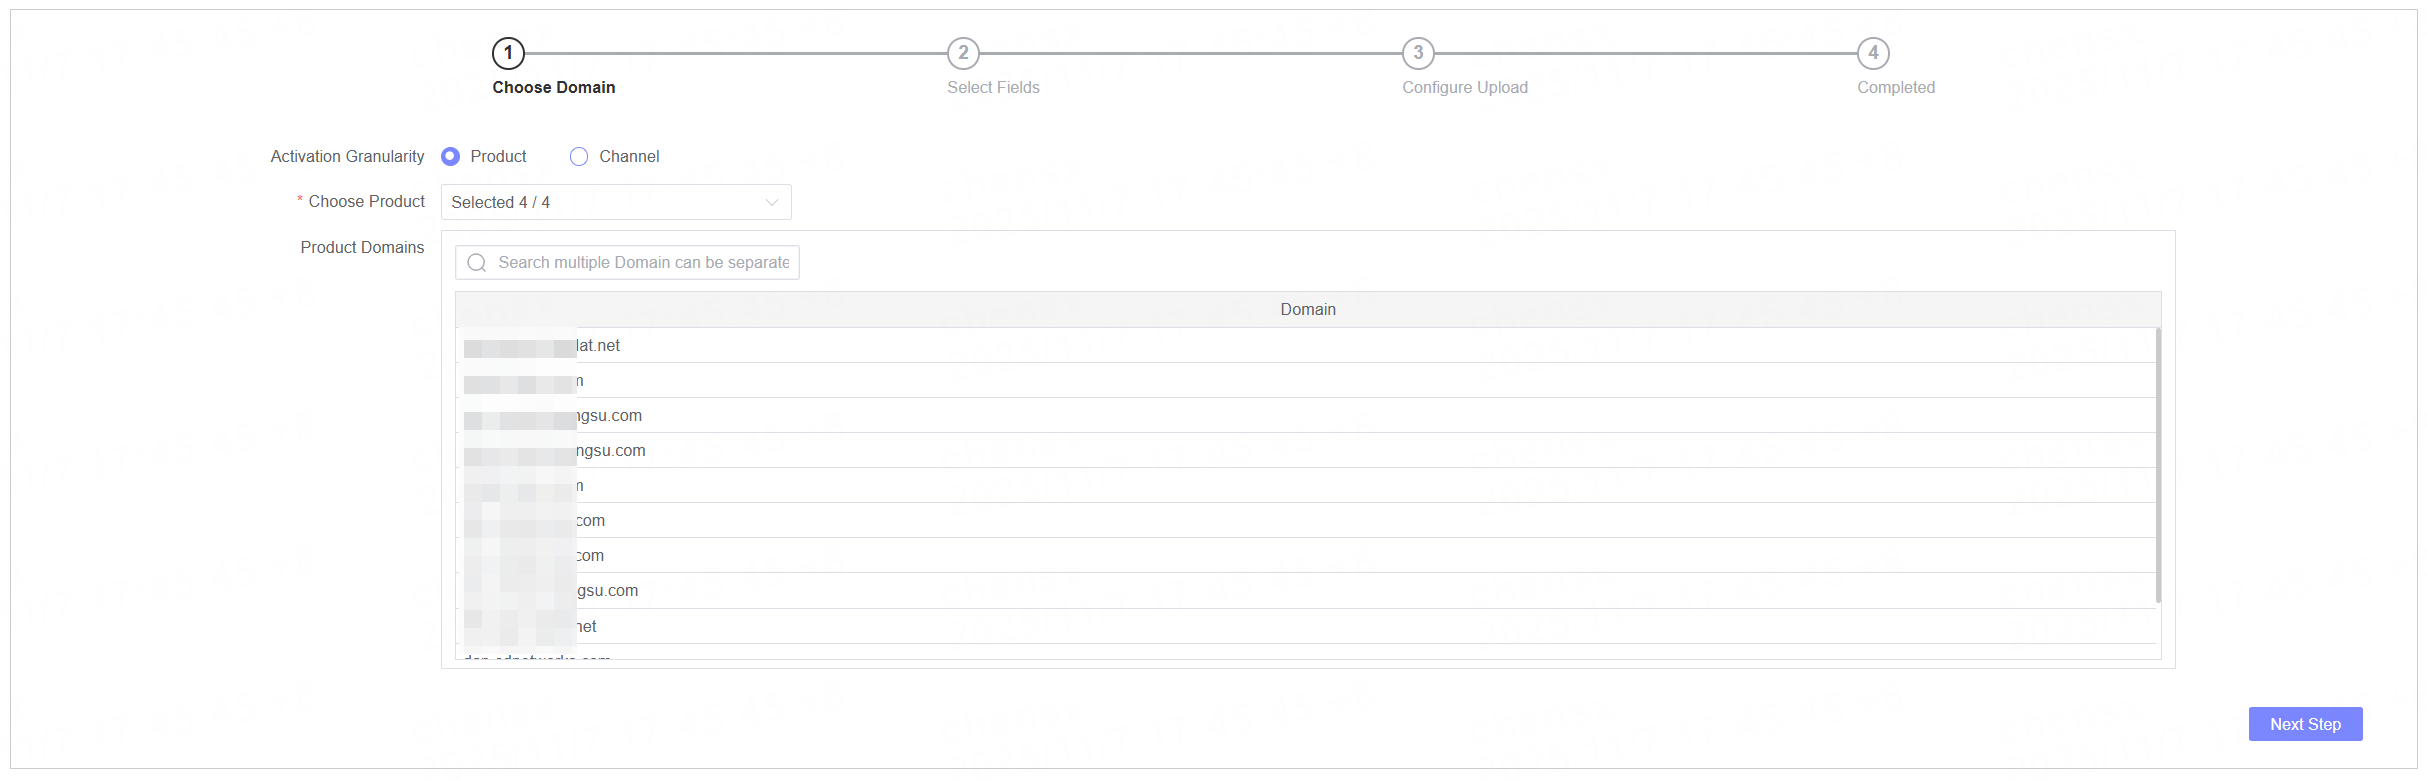
Only native platform data requires this step.
| Name | Description |
|---|---|
| Activation Granularity | Supports domain selection by Product or Domain.If activated by Product, all domains under the selected product will be activated by default.If activated by Domain, you need to specify the domain, which can be filtered by selecting a product. |
| Select Product/Domain | Select the target product or domain. |
| Domain List | Displays all domains under the selected product or the selected domains. |
Step 2: Dashboard Configuration
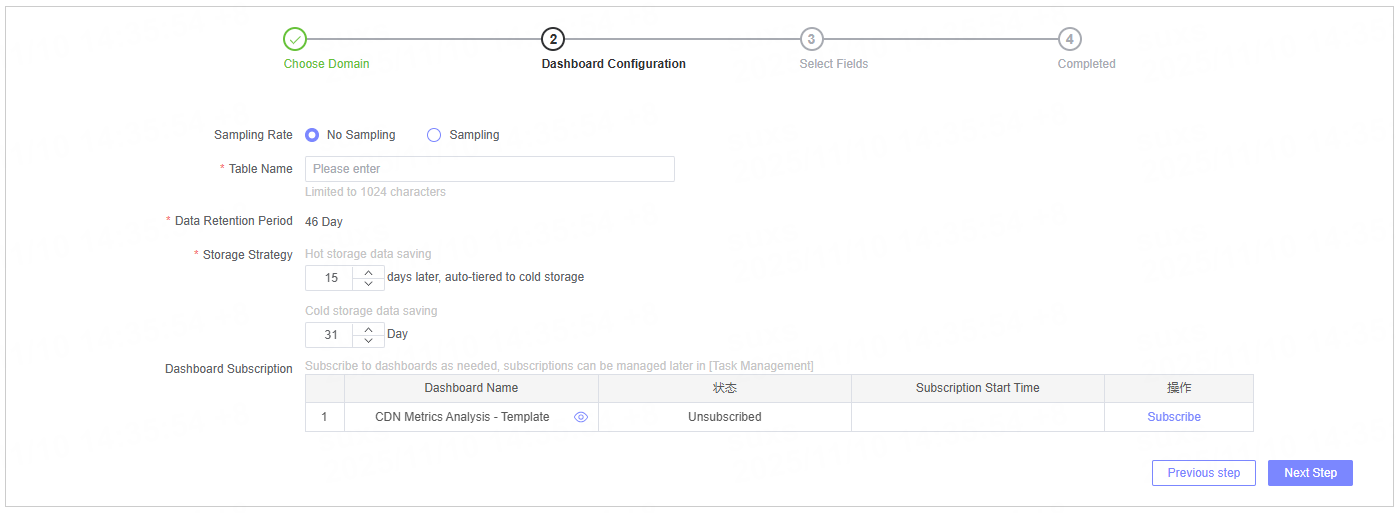
| Name | Description |
|---|---|
| Sampling Rate | Set the sampling rate for file downloads.By default, all data is downloaded (no sampling); you can customize the sampling rate as needed. |
| Table Name | This is required for subsequent data visualization and analysis. Specify the name of the storage table. |
| Log Retention Time | Default is 46 days. The system will automatically adjust according to the storage policy. |
| Storage Policy | Set the retention duration for hot and infrequent storage. |
| Subscribe to Dashboard | Supported only for platform native data.The system provides frequently used analysis reports that can be directly subscribed to. For details about dashboard templates, see Subscribe to Dashboard |
Step 3: Select Fields
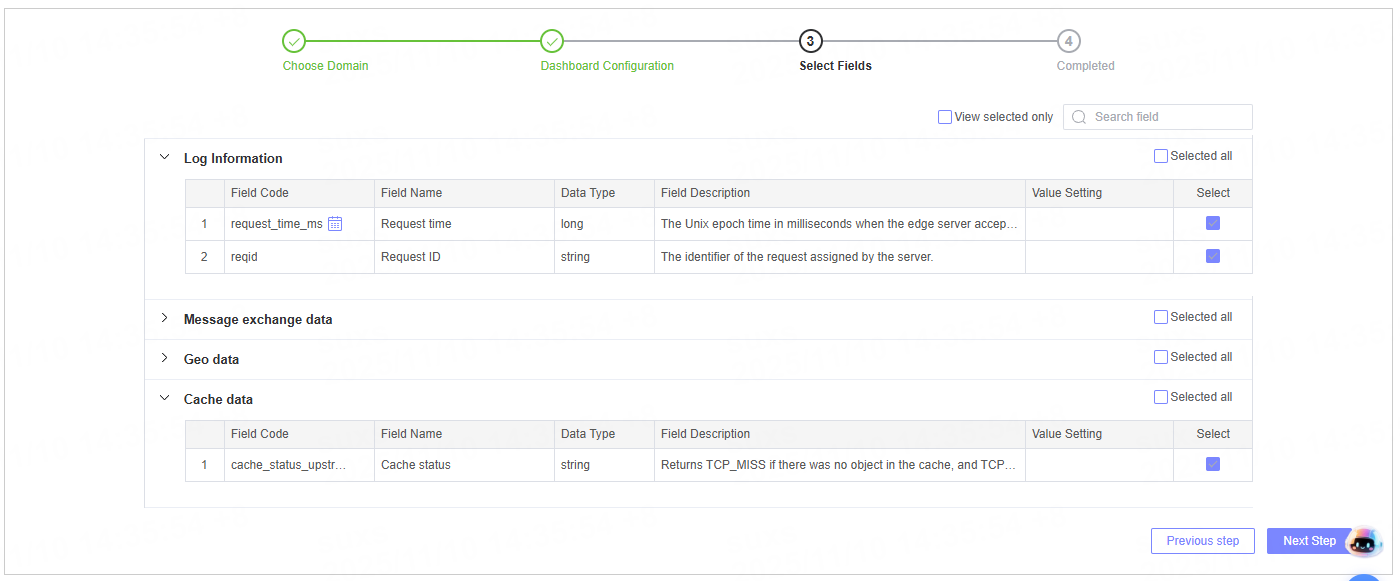
- Display the field categories of the selected logs (only supported for native platform data), including field code, name, data type, and description. You can select fields as needed for analysis.
- If a subscribed dashboard is used, the system will automatically select the required fields.
- The time field is mandatory and is selected by default. It cannot be deselected.
Step 4: Submit Task
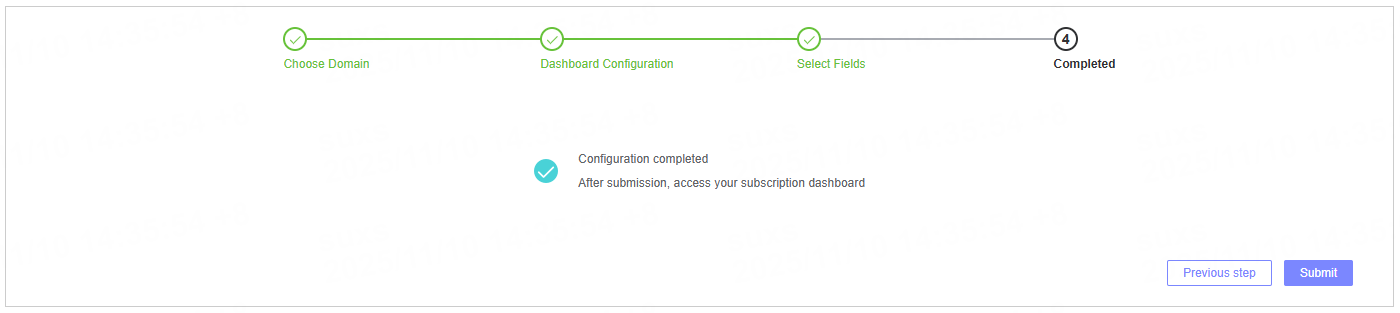
After completing the configuration, click the Submit button to submit the consumption task. Once the task is submitted, you will be redirected to the Dashboard page, where you can view your subscribed dashboards or create a new dashboard for data analysis.
Next Steps
Select the log data you have integrated for visualization and report analysis. For detailed instructions, please refer to Analyze Data Using Dashboards.
Consumption Task Management
In the Task Management list, you can view created consumption tasks and perform operations such as Edit, Pause, Monitor, and View Modification History.
For more details, please refer to Task Management.