CDN Metrics Analysis Template
Last update:2025-11-14 14:53:11
CLS provides pre-configured dashboard templates for platform native data. In Configure Data Consumption - Dashboard, you can subscribe to the relevant templates to meet your personalized business monitoring and visualization needs.
This article introduces the main features of the CDN metrics analysis dashboard templates.
Main Metrics of the CDN Metrics Analysis Dashboard
| Metric Name | Description |
|---|---|
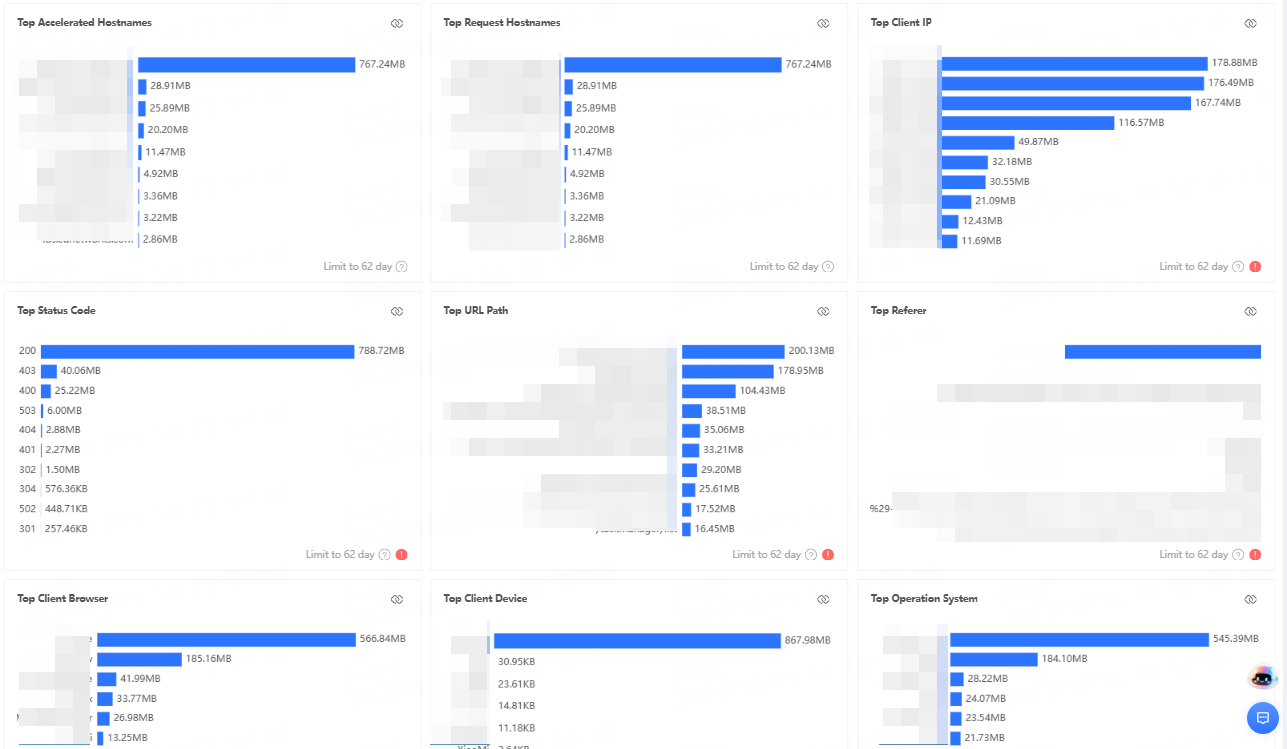
| CDN Response Traffic Analysis | Tracks the traffic transferred between the CDN and clients. Clicking CDN Response Traffic Analysis allows you to view traffic trends across different dimensions, regional traffic distribution, accelerated Host ranking, request Host ranking, client IP ranking, HTTP status code ranking, and more. Bandwidth calculation: By default, it uses a 5-minute granularity, calculated as total traffic within 5 minutes × 8 ÷ 300 seconds. The granularity can be adjusted as needed. |
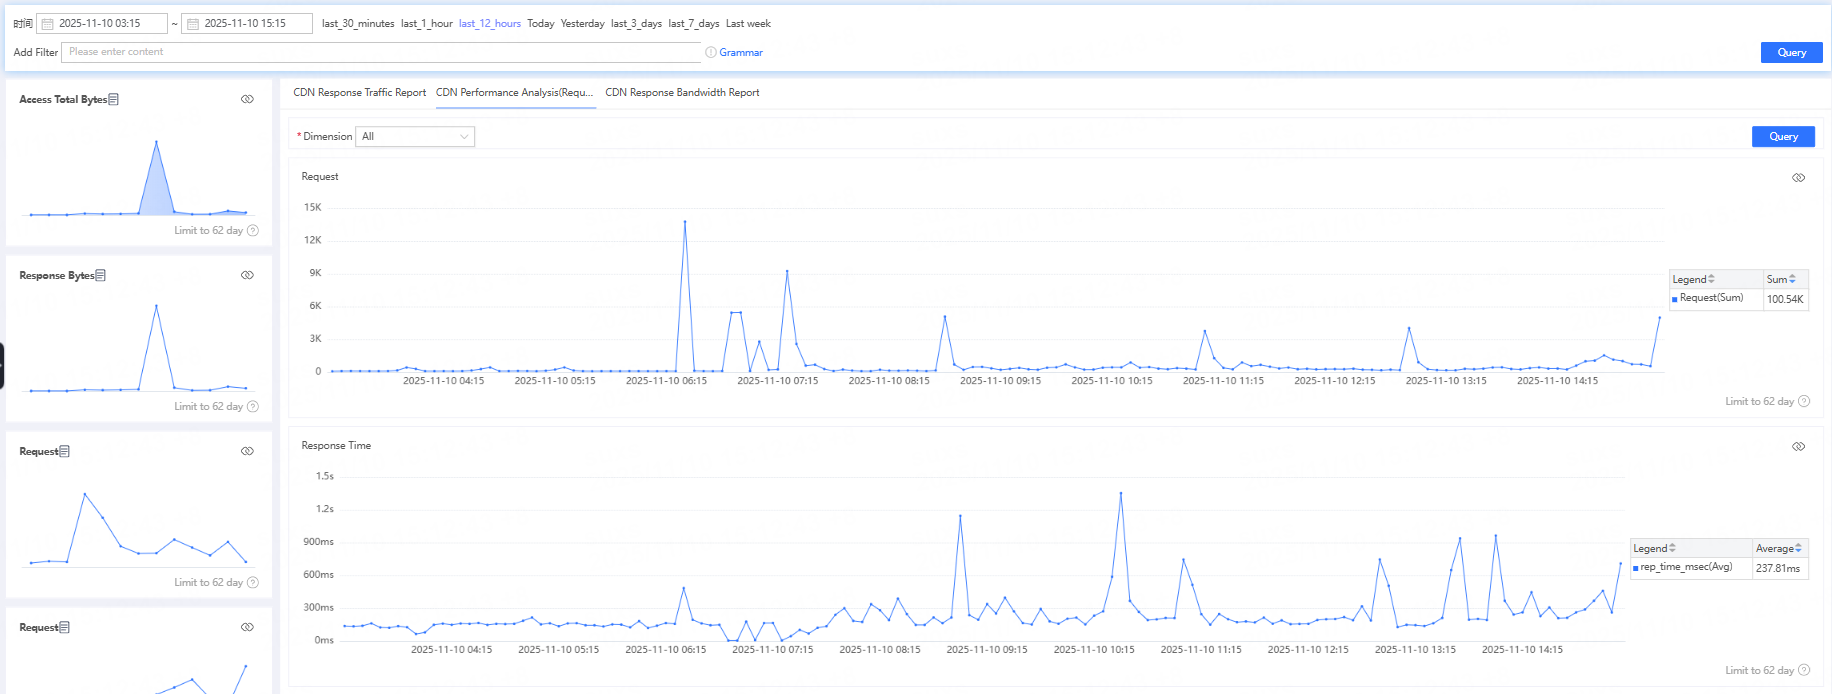
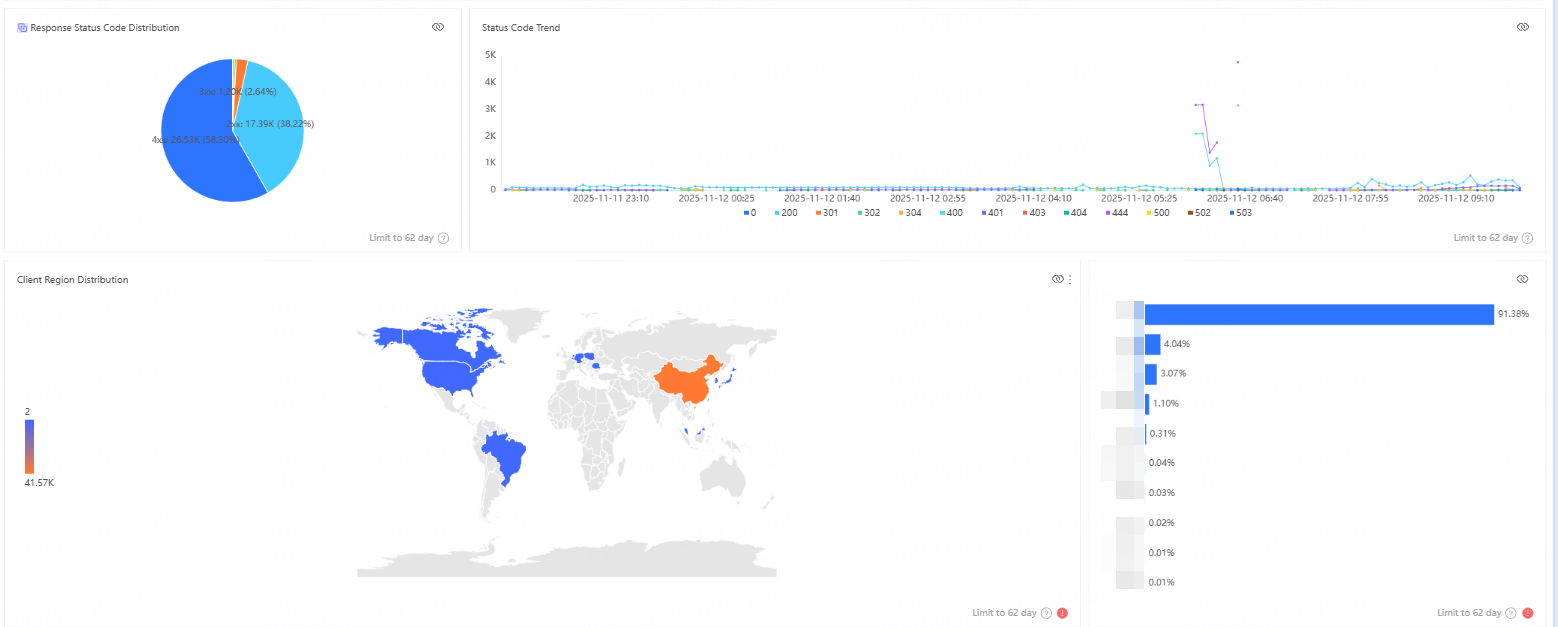
| CDN Access Performance Analysis (Request Count) | Tracks the number of client requests the CDN receives and performance metrics. After clicking CDN Access Performance Analysis, you can view request count trends, response time trends, response code distribution, access region distribution, and other metrics from multiple perspectives. |
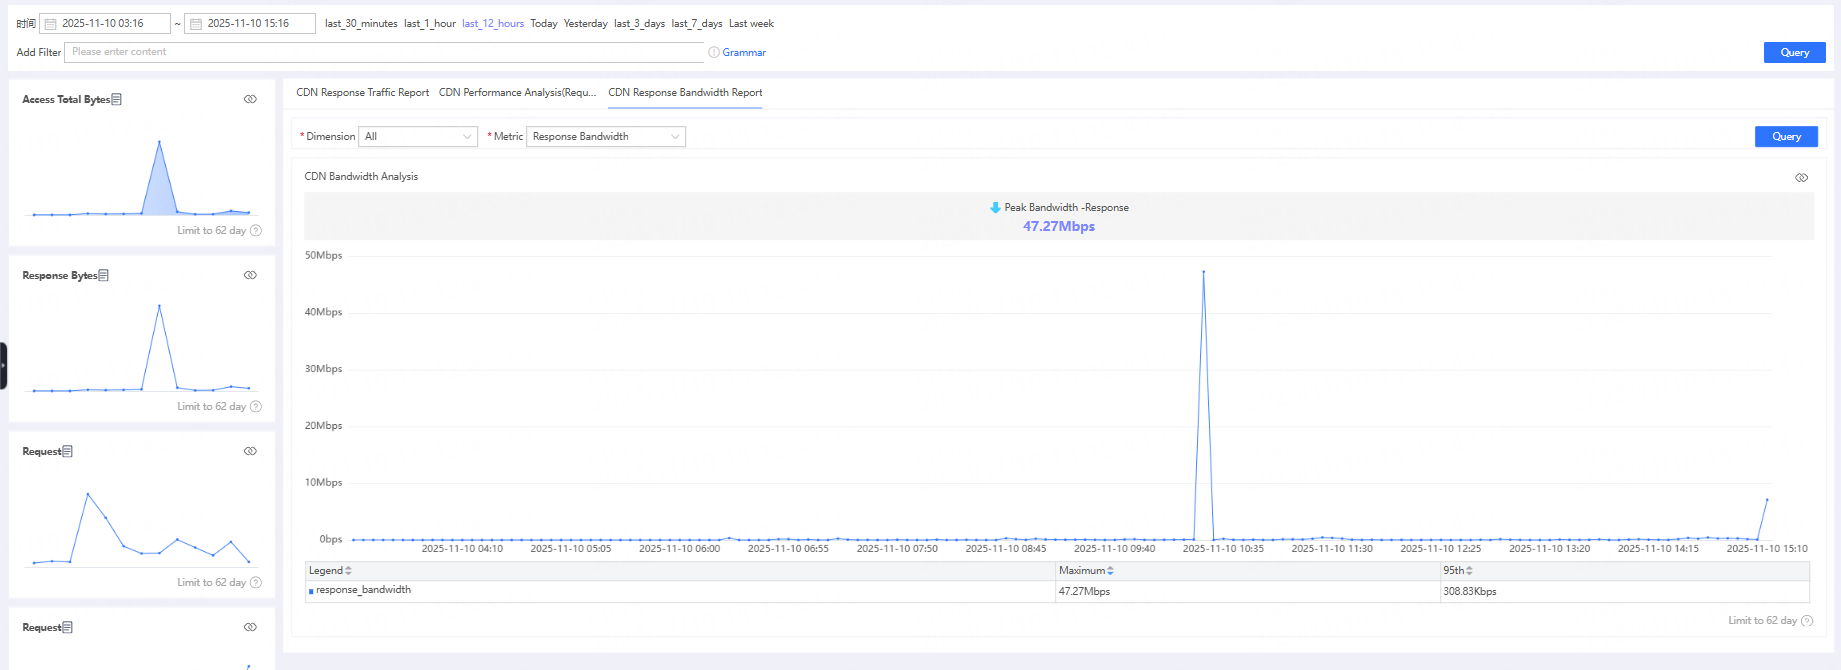
| CDN Response Bandwidth Analysis | Statistics on the bandwidth transmitted between the CDN and the client. After clicking CDN Response Bandwidth Analysis, you can view upstream bandwidth/downstream bandwidth from different dimensions. |
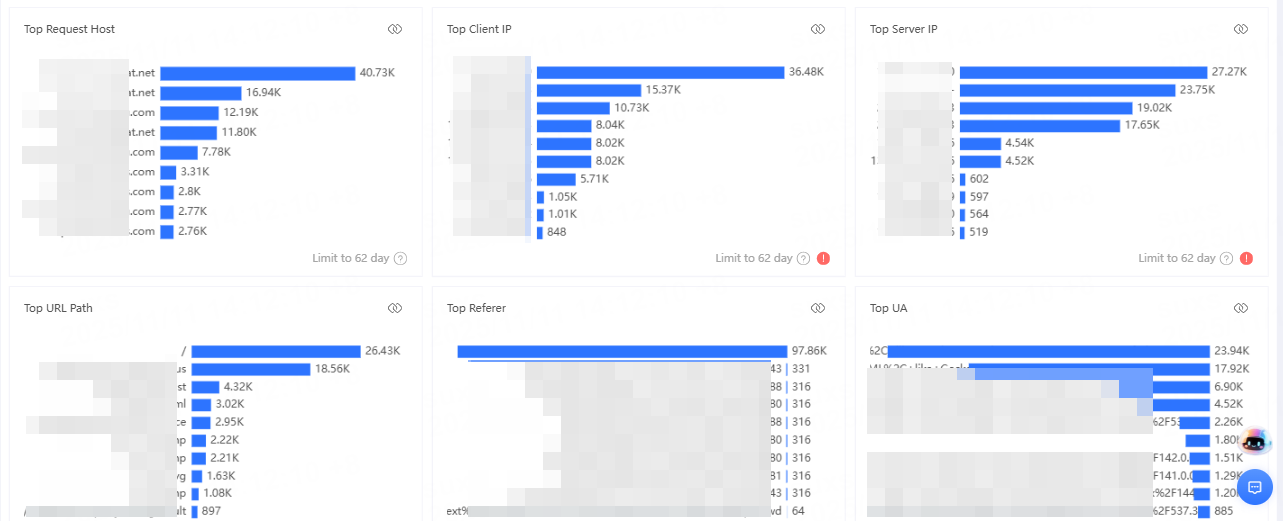
View CDN Response Traffic Analysis
After clicking CDN Response Traffic Analysis, you can view access traffic trends, access region distribution, top accelerated hosts, top requested hosts, top client IPs, top status codes, and more, from different dimensions.
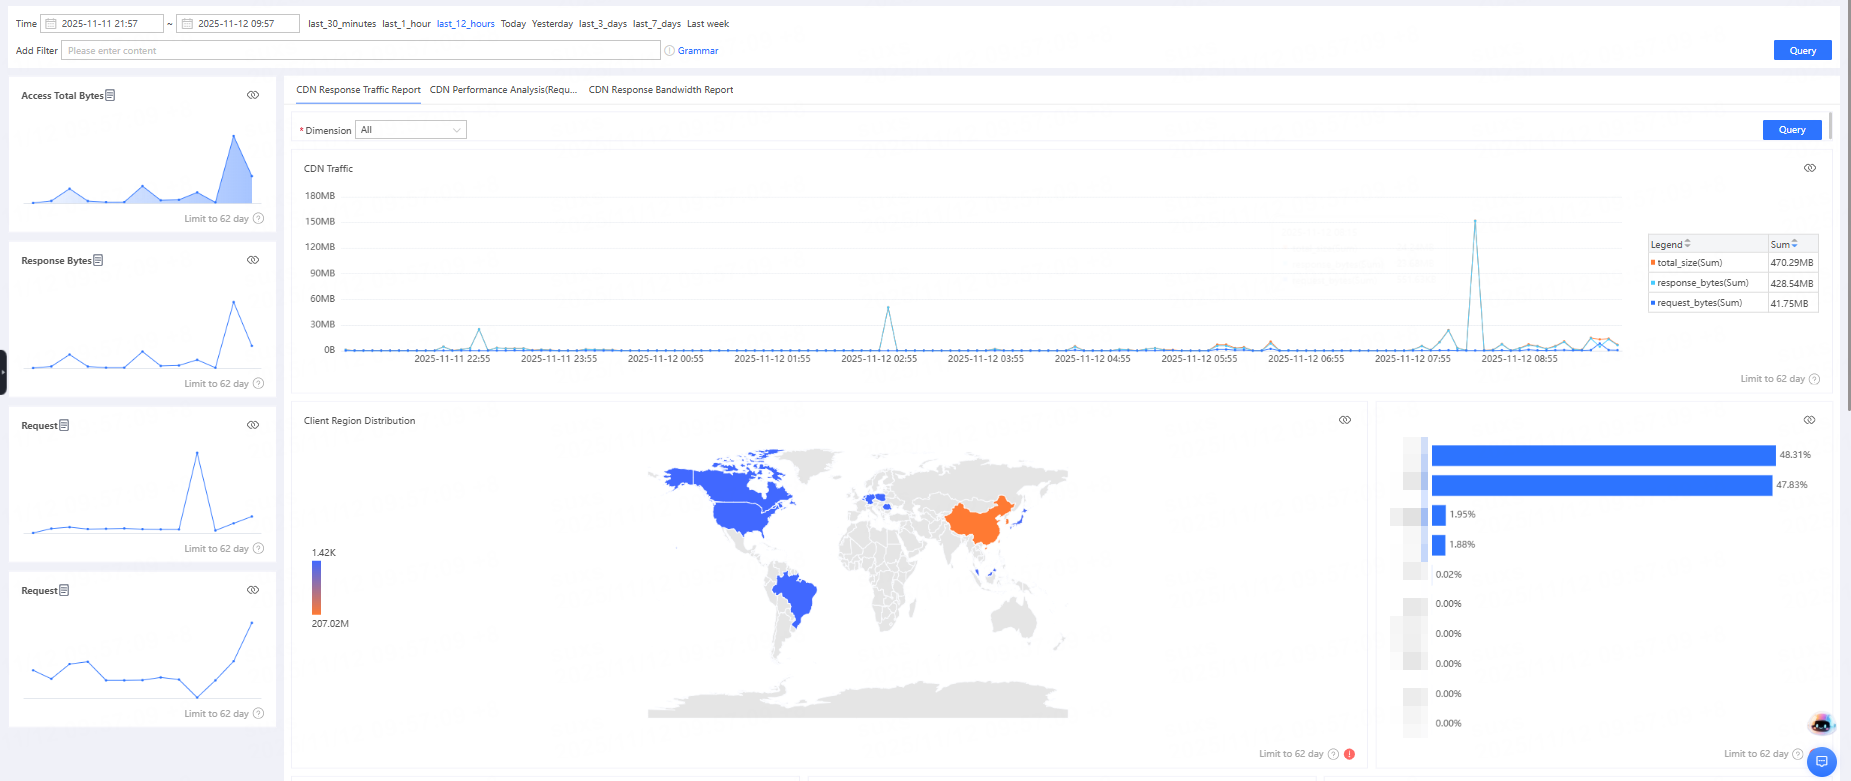
Bandwidth calculation method: Bandwidth is calculated based on 5-minute granularity: total traffic within 5 minutes × 8 ÷ 300 seconds. The granularity can be adjusted according to actual needs.
View CDN Access Performance Analysis (Number of Requests)
After clicking CDN Access Performance Analysis, you can view metrics such as request count trends, response time trends, response status code distribution, and access region distribution from different perspectives.
View CDN Response Bandwidth Analysis
After clicking CDN Response Bandwidth Analysis, you can view response upstream bandwidth/downstream bandwidth across different dimensions.
To change the preset dashboard or create a custom dashboard, please refer to Using Dashboards for Data Analysis.