CDN Back-to-Src Template
최신 업데이트:2025-11-14 14:53:12
CLS has provided relevant dashboards pre-configured for platform native data. When configuring data consumption dashboards, you can subscribe to the corresponding dashboards to meet your personalized business monitoring and visualization needs.
This article introduces the main features of the preset CDN origin metrics analysis dashboards.
Main Metrics of the CDN Origin Metrics Analysis Dashboard
| Metric Name | Description |
|---|---|
| Key Metrics Analysis | Provides statistics on traffic and bandwidth between the CDN and the origin. After clicking Key Metrics Analysis, you can view origin traffic, bandwidth, origin response time, top origin IPs by response traffic, top CDN node IPs by response traffic, and top accelerated Domains by response traffic across different dimensions. Bandwidth calculation: By default, uses a 5-minute granularity. Total traffic over 5 minutes × 8 ÷ 300 seconds. Granularity can be adjusted as needed. |
| Origin Availability Analysis | Counts the number of requests initiated by the CDN to the origin as well as the availability of the origin. After clicking Origin Availability Analysis, you can view origin status code trends, origin IP request count trends, origin 5xx error trend analysis, and more. |
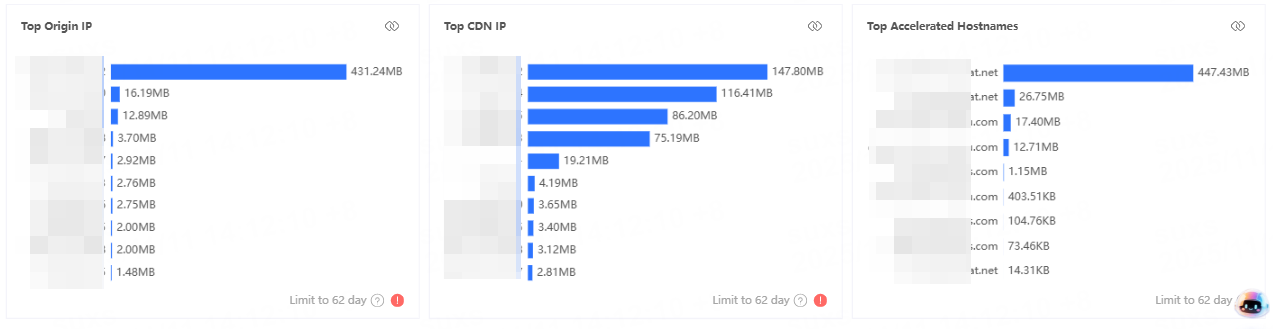
View Key Metric Analysis
After clicking Key Metric Analysis, you can view traffic and bandwidth between the CDN and the origin site, origin IP response traffic rankings, CDN node IP response traffic rankings, and acceleration domain response traffic rankings, as well as origin response time.
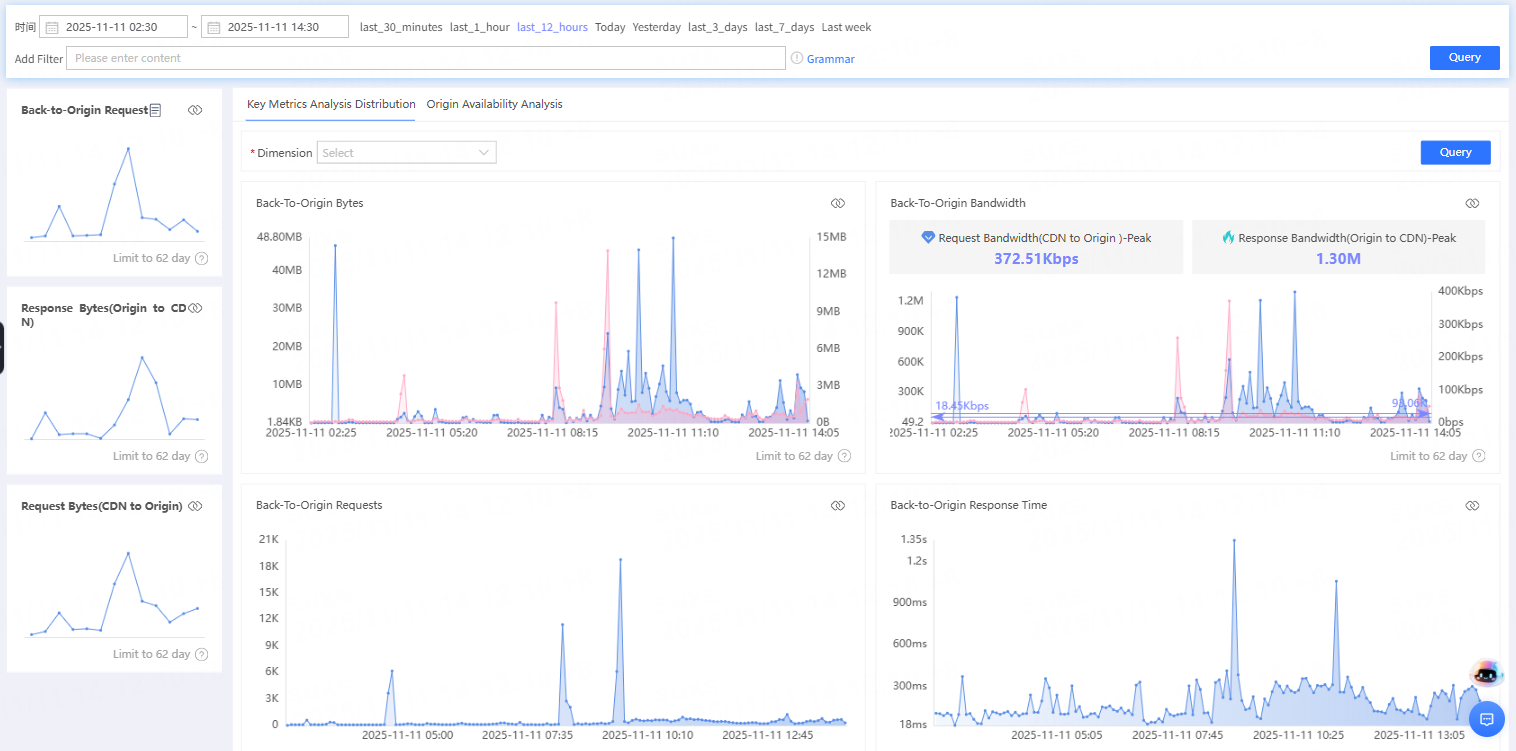
Bandwidth calculation method: Using a 5-minute interval, bandwidth = total traffic within 5 minutes × 8 ÷ 300 seconds. The interval can be adjusted as needed.
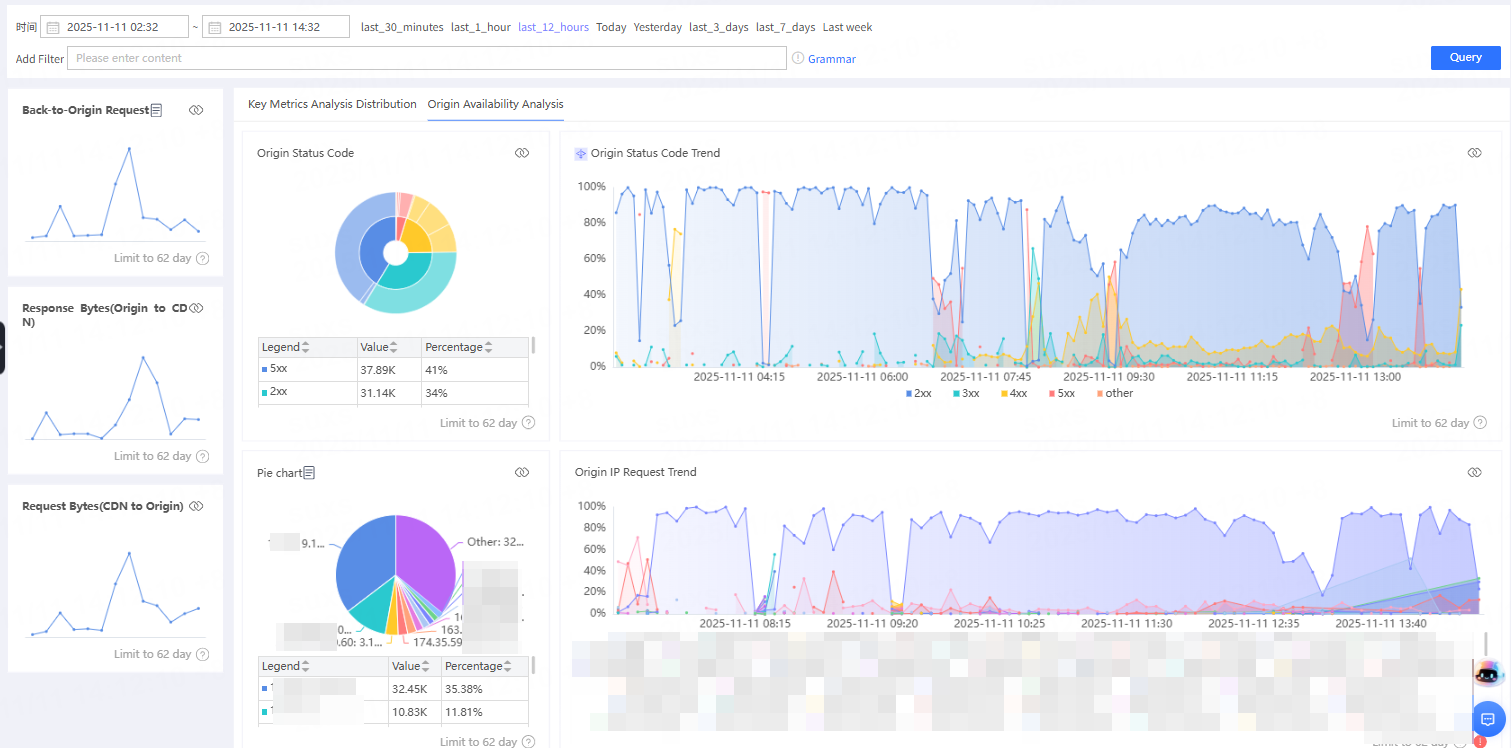
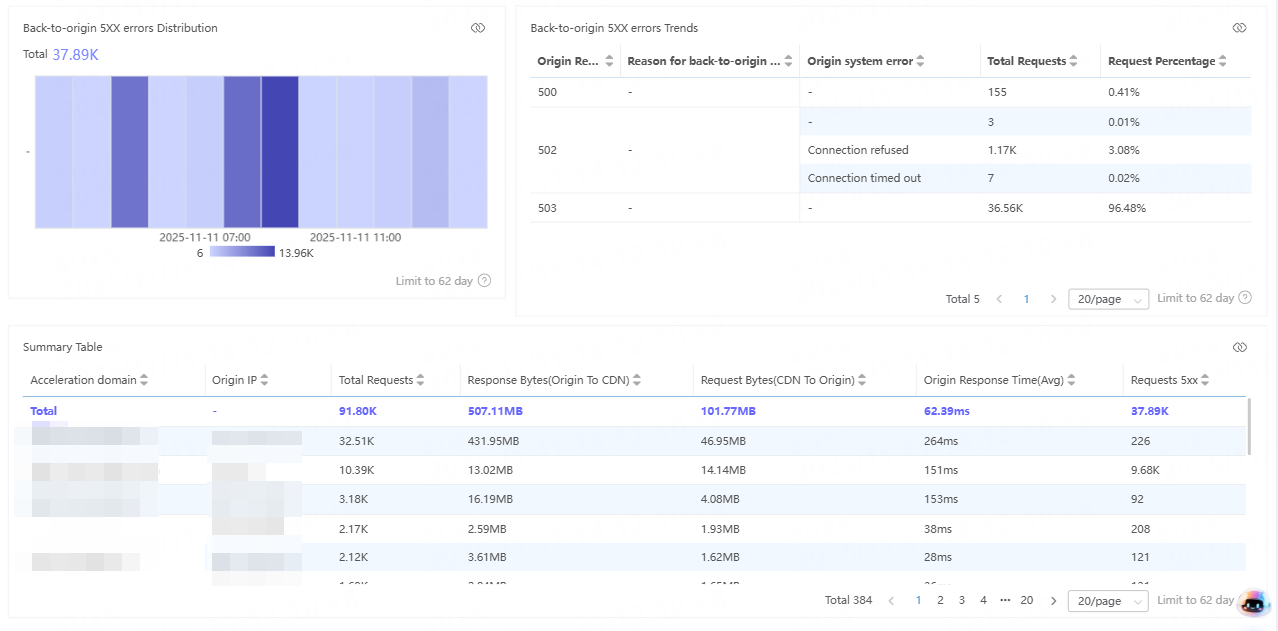
View Back-to-origin Availability Analysis
After clicking Back-to-origin Availability Analysis, you can view trends of back-to-origin status codes, changes in the number of requests to origin IPs, reasons for 5xx back-to-origin errors, and more.
To modify the default dashboard or create a custom dashboard, please refer to Using Dashboards to Analyze Data.