Dashboard
Last update:2023-06-13 10:54:23
1. Usage Scenario
Enterprise Secure Access Dashboard provides the following benefits and enable you to:
- View real-time visibility into your organization’s Internet traffic;
- Insight reports on threat events, device compliance, dynamic access control logs, etc. so that IT administrators can quickly get status and take actions.
- Overview about your service bundle and usage
2. Operation Steps
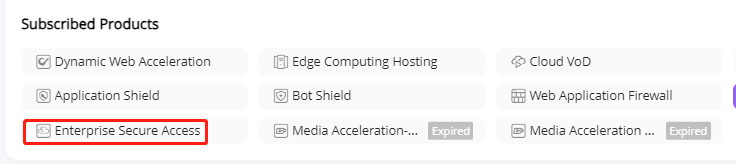
Configuration Path: Login to Console and find ESA’s portal entry:
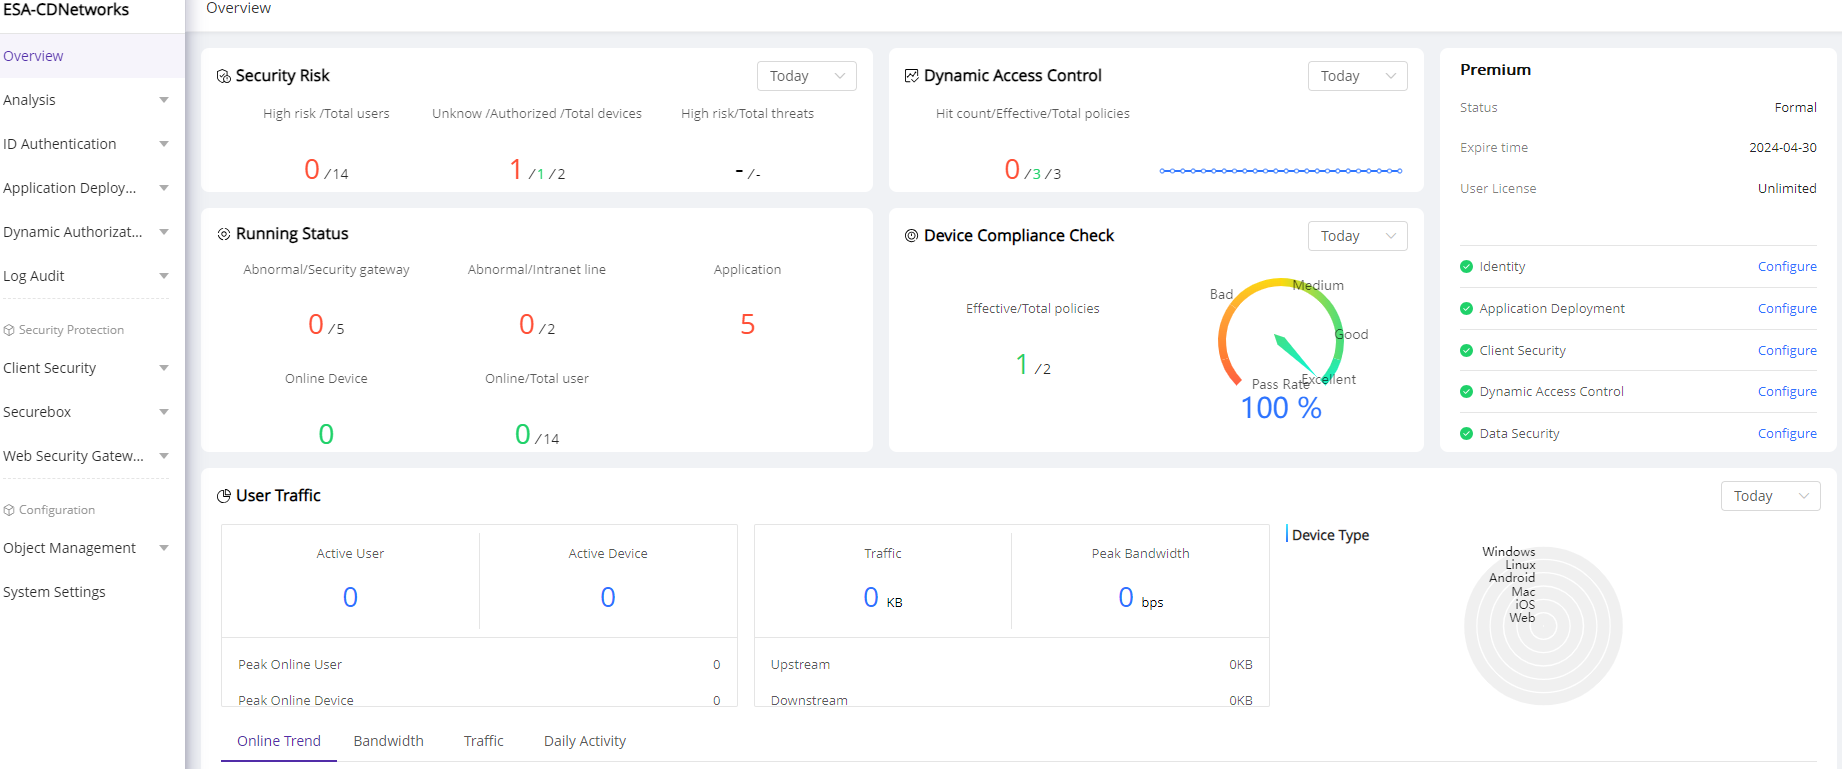
On this page, you will find quick view about:
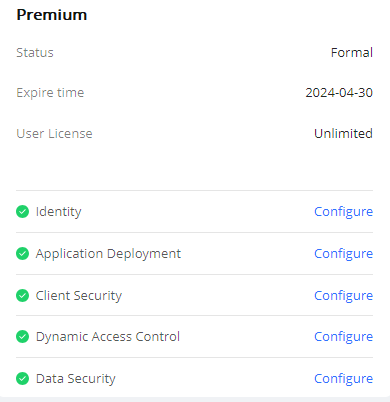
1)Your service bundle, related feature list and service status
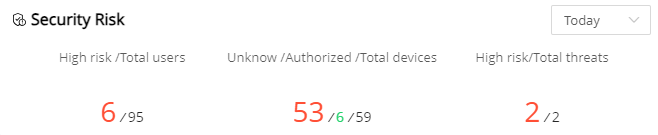
2)Security Risk Reports
High risk data only avalable on customers who are using Premium bundle and have Trust Engine feature configured.
It displays the security risk insight of devices, users and threat events.
| Field Name | Explanation |
|---|---|
| High risk /Total users | High-risk users: The number of high-risk users within the query time. High-risk users refer to users whose trust level has been evaluated as high risk by the trusted engine. Total users: The total number of users in the current enterprise. |
| Unknow /Authorized /Total devices | Unknown devices: The number of devices in the unauthorized device list. Authorized devices: The number of devices in the authorized device list. Total devices: The sum of unauthorized devices, authorized devices, and block listed devices. |
| High risk/Total threats | High-risk threats: The number of high-risk threats within the query time. Total threats: The total number of threats within the query time. |
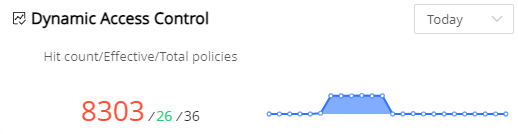
3)Dynamic Access Control Overview
It displays the access control insight of total policies, policies been enabled and hit.
| Field Name | Explanation |
|---|---|
| Hit count/Effective/Total policies | Hit count: Total number of access control policies been hit during the query time. Effective Policies: Number of access control policies currently enabled. Total Policies: Total number of access control policies been defined |
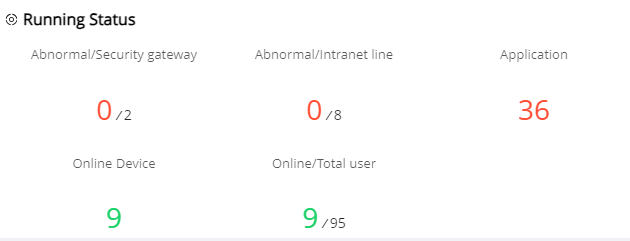
4)Running Status
It displays the running status of security gateways, intranet lines, applications, users and user devices.
| Field Name | Explanation |
|---|---|
| Abnormal/Security gateway | Security gateway: Total number of Security Gateways in the current enterprise Abnormal security gateway: Number of Security Gateways with abnormal status in the current enterprise. |
| Abnormal/Intranet line | Intranet line: Total number of lines Abnormal Intranet line: Number of lines with abnormal status |
| Application | Total number of custom applications and SaaS applications been added |
| Online device | Number of devices online |
| Online/Total user | Online users: Number of users online Total users: Total number of users in the organization structure |
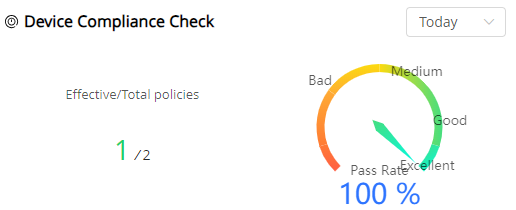
5)Device Compliance Check
This report only available for customers who are using Premium bundle and have Device Compliance Check feature configured.
It displays the compliance check results of user access devices. IT administrators defines the items and policies to be checked on user devices. When user login to ESA, device information and behavior will be checked, logged and compared to policies pre-defined.
| Field Name | Explanation |
|---|---|
| Effective/Total policies | Effective policy: The number of policies enabled for device compliance checks Total policies: The total number of policies for defined for compliance checks |
| Pass Rate | The percentage of devices that passed device compliance checks during the query time |
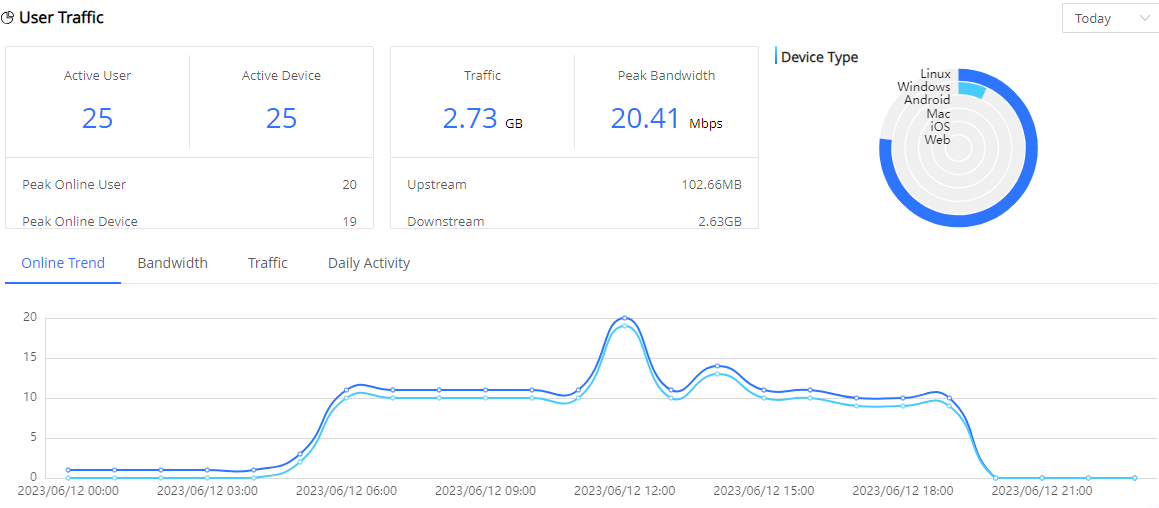
6)User Traffic Reports
It displays insight to traffic statistics of from users.
| Field Name | Explanation |
|---|---|
| Active User | Total number of users who logged in during the query period |
| Active Device | Total number of devices that logged in during the query period |
| Peak Online User | Peak number of concurrent users during the query period (hourly granularity) |
| Peak Online Device | Peak number of concurrent devices during the query period (hourly granularity) |
| Traffic | Total traffic of all users during the query period |
| Peak Bandwidth | Peak bandwidth of all users during the query period |
| Upstream | Total amount of client upload traffic during the query period |
| Downstream | Total amount of client download traffic during the query period |
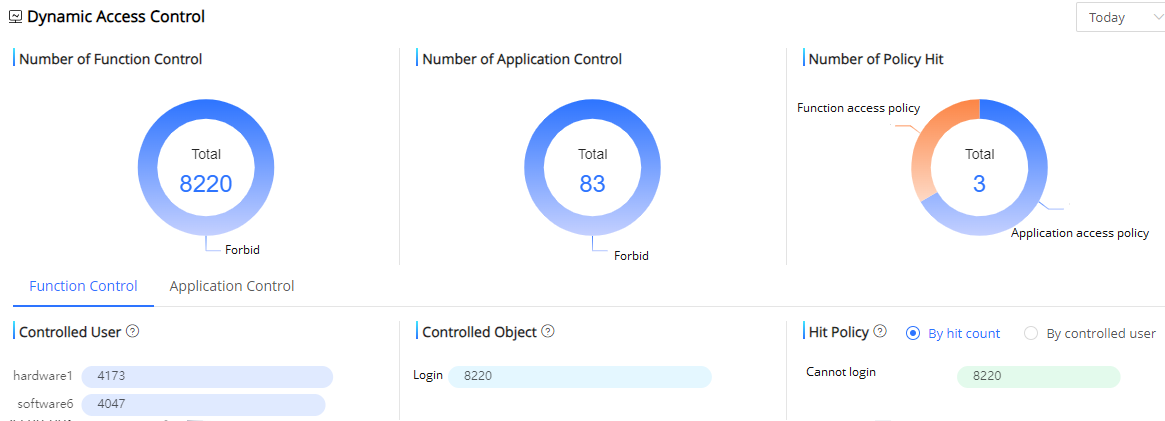
7)Dynamic Access Control
It displays insight of function control policies, application control polices and the policies been hit.
| Field Name | Explanation |
|---|---|
Number of Function Control |
Number of searches with hits and distribution of actions for functionality control during the query period |
| Number of Application Control | Number of searches with hits and distribution of actions for application control during the query period |
| Number of Policy Hit | Number of hits for functionality and application control during the query period |
| Controlled User | Top 10 users with the highest hit number of function/application access control policies during the query period |
Controlled Object |
Top 10 objects with the highest hit number of function/application access control policies during the query period |
| Hit Policy | Top 10 access control policies been hit during query time. The query result can display by hit count or by controlled user |
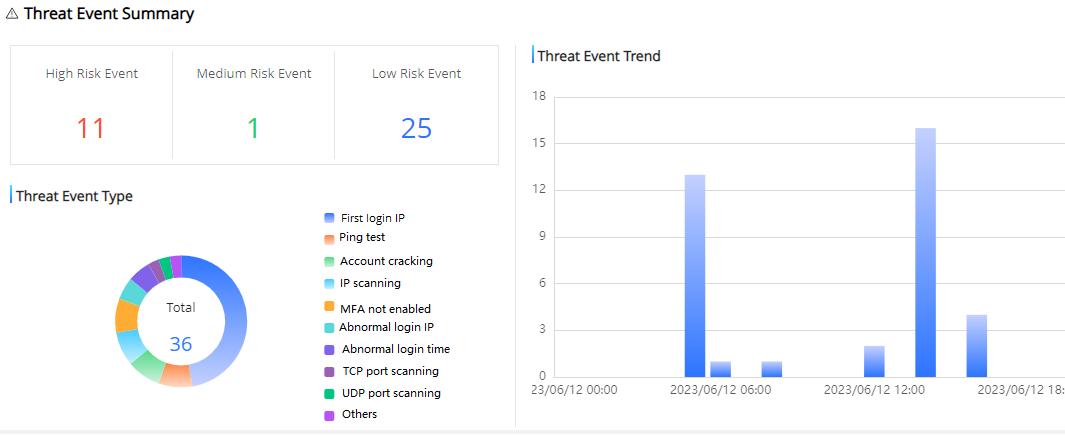
8) Threat Event Summary
This report only available for customers who have purchased the value-added service called Network Traffic Analysis. We have pre-installed a large number of network threat events from our own threat intelligence or integrating with 3rd party intelligence. IT administrators can also self-defined threat events and define risk level. After that, ESA platform will monitor network traffics and logs to detect threat events. This report gives an overview of how many threat events have been detected, their security levels and the trend.
| Field Name | Explanation |
|---|---|
High Risk Event |
Total number of high-risk events been recognized during query time |
| Medium Risk Event | Total number of medium-risk events been recognized during query time |
| Low Risk Event | Total number of low-risk events been recognized during query time |
| Threat Event Type | The number and percentage of threat events been detected during the query time |
| Threat Event Trend | The trend of threat events been detected during the query time |