View Alert Logs
Last update:2025-07-09 15:35:15
This guide explains how to access and query your alert history in the Cloud Monitor service. You can access the alert logs by navigating to the following section in your product dashboard:
Application Services → Cloud Monitor → Alert Logs
Querying Alert Logs
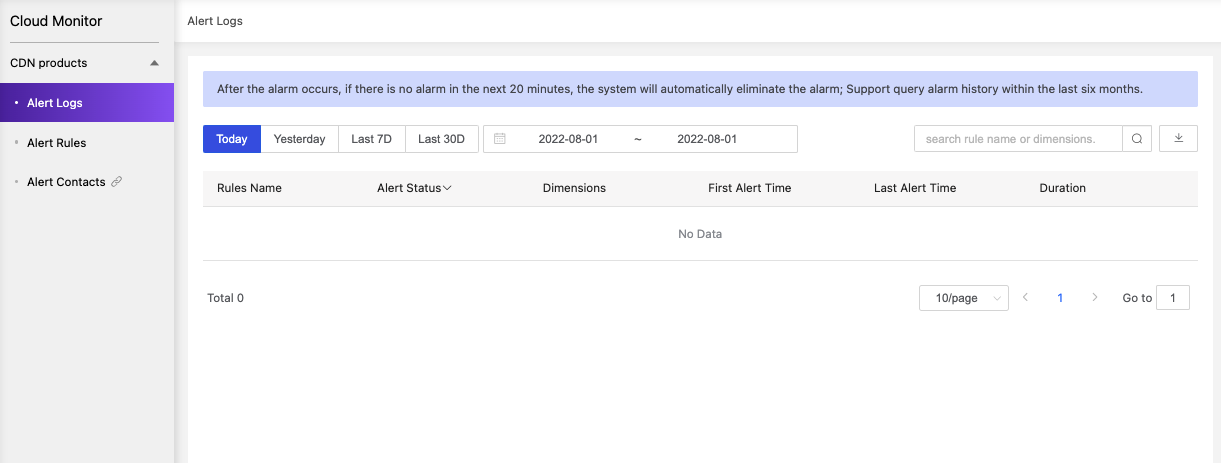
The Alert Logs page displays detailed information about every alert that has been triggered, including the alert time, rule name, the object that triggered the alert, and the alert’s status.
To find specific logs, you must first define your query using the available filters:
-
Filter by Date Range: Select a start and end date to view all alerts generated within that period.
-
Filter by Keyword: Enter a keyword, such as a rule name or alert object, to search for specific log entries.
Once you have set your filters, the system will display the matching alert logs.
Important Query Limitations
Please keep the following constraints in mind when querying your logs:
Data Retention: Alert log data is available for a maximum of 6 months.
Query Span: Each individual query can cover a maximum date range of 31 days.