Configure Webhook Notifications
Last update:2025-07-15 11:20:05
Use Webhook callbacks to receive alert notifications at a custom URL, enabling you to build automated monitoring and response workflows. This guide walks you through the configuration and testing process.
Configuration Steps
1. Create an Alert Rule
To use the Webhook feature, you must first create an alert rule that will trigger the notification.
- Navigate to Cloud Monitor → Alert Service → Alert Rules.
- Click the Create Alert Rule button.
- Set the rule’s name and define the alert conditions.
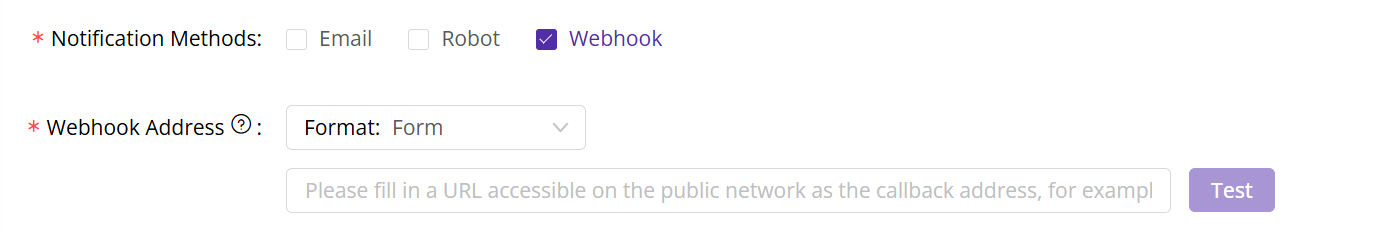
- In the “Notification Method” section, select the Webhook Callback option.
2. Configure the Webhook URL
When creating the alert rule, you will need to specify the destination URL for the Webhook callback.
- Enter the URL where you want to receive alert notifications. Ensure this is a publicly accessible URL and that your server is configured to handle POST requests.
- Save your changes.
Note: Your Webhook endpoint must be able to correctly parse and respond to POST requests from the Cloud Monitoring system to avoid notification failures.
Testing the Webhook Callback
To confirm that your configuration is correct, you should perform a test.
- Click the Test button located next to the Webhook URL input field. This will simulate an alert and send a test payload to your URL.
- Verify that your endpoint received the test payload from the monitoring system.
The callback will be a POST request containing a JSON body with the following parameters. Please ensure your endpoint can handle additional parameters, as new fields may be added in the future.
Here is an example of the JSON payload your endpoint will receive:
{

"loginName": "user@example.com",

"alarmTime": "2025-07-09T15:22:00Z",

"ruleName": "High Bandwidth Alert",

"monitor": "Total bandwidth exceeded 100Gbps."

}
| Parameter | Type | Description |
|---|---|---|
| loginName | string | The account name associated with the alert rule. |
| alarmTime | string | The timestamp when the alert was triggered. |
| ruleName | string | The name of the alert rule that was triggered. |
| monitor | string | The content or description of the alert. |
If you do not receive the test notification, please check your network connection and endpoint configuration to ensure they are working correctly.
Troubleshooting
If you are not receiving notifications, check the following common issues:
- Incorrect URL: Verify that the Webhook URL is correct and publicly accessible.
- POST Request Handling: Ensure your endpoint is correctly configured to handle POST requests and parse the JSON payload.
- Network Connectivity: Check for any firewall rules or network issues that might be blocking incoming requests from the monitoring system.
Once configured, your Webhook integration will enable automated, real-time event notifications. You can now build custom logic to parse these alerts and trigger automated responses, significantly improving your incident management efficiency.