Function Analysis
Last update:2026-05-15 16:45:48
This document explains how to access function invocation metrics in the CDNetworks console to monitor function performance and health.
Viewing Steps
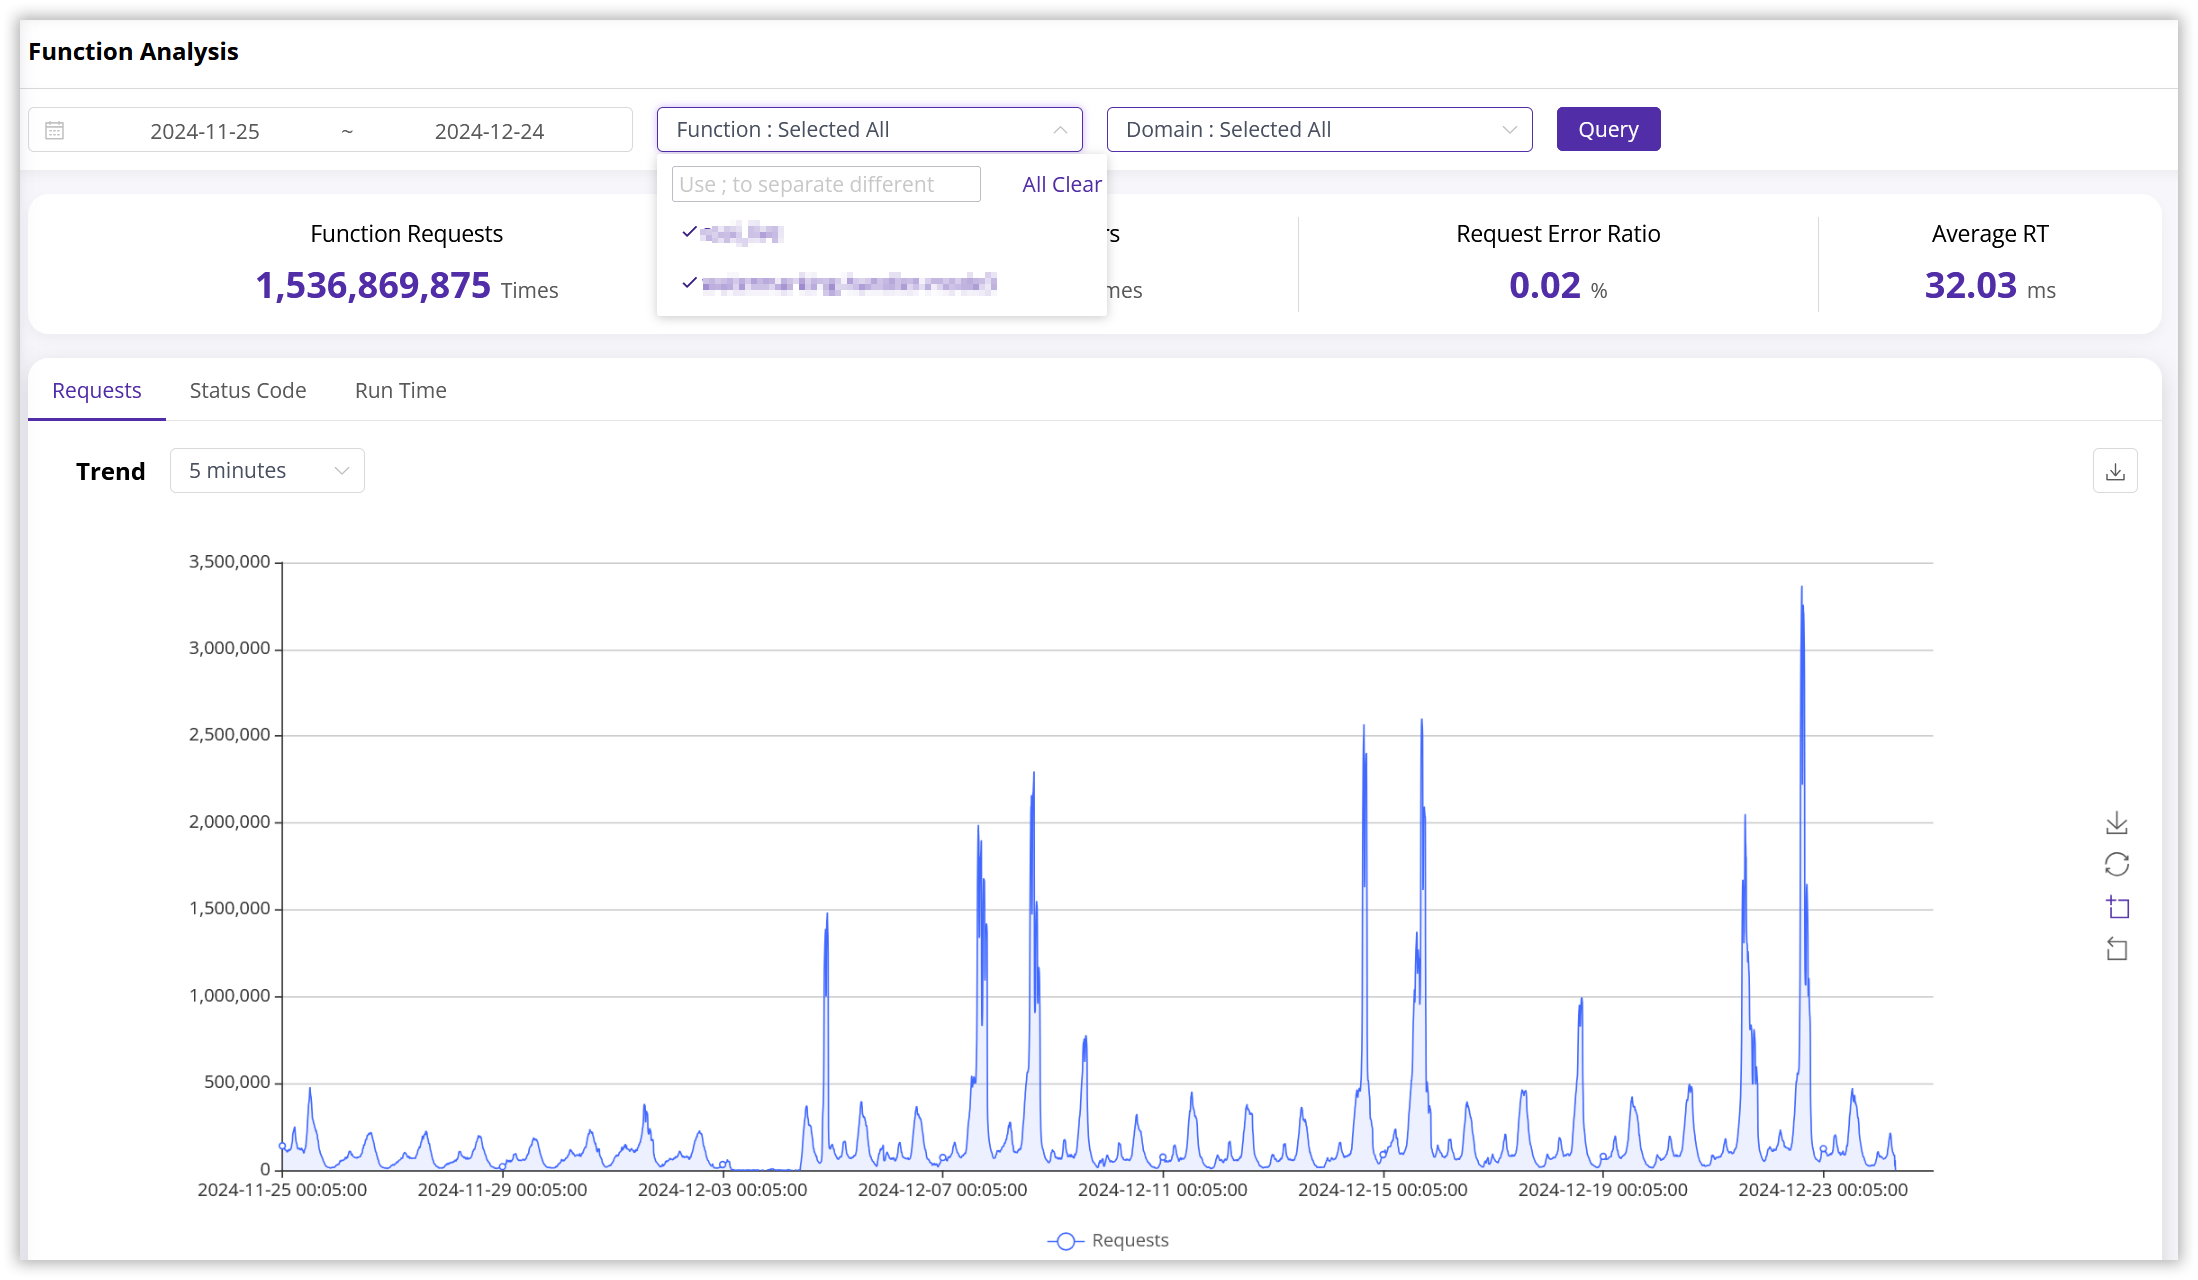
- Log in to the CDNetworks Console, select Edge Application, navigate to the Edge Cloud Apps menu, and click Function Analysis.
- Set the filter criteria and click Query. You can combine the following criteria:
- Date Range: The time range for the data you want to analyze.
- Function: The specific function to analyze.
- Associated Domain: The domain associated with the function.
Metrics
Function invocation analysis provides statistics across four dimensions:
1. Overview

| Metric | Unit | Description |
|---|---|---|
| Requests | Count | The total number of requests made to the functions. |
| Error Requests | Count | The total number of requests that resulted in 4xx or 5xx HTTP status codes. |
| Error Rate | % | Error Rate = (Error Requests / Requests) * 100% |
| Average Runtime | ms (milliseconds) | The average function execution time over the specified period, calculated as the total execution time across all functions divided by the total number of requests, rounded to two decimal places. |
2. Request Analysis
View request trends with a granularity of 5 minutes, 1 hour, or 1 day.
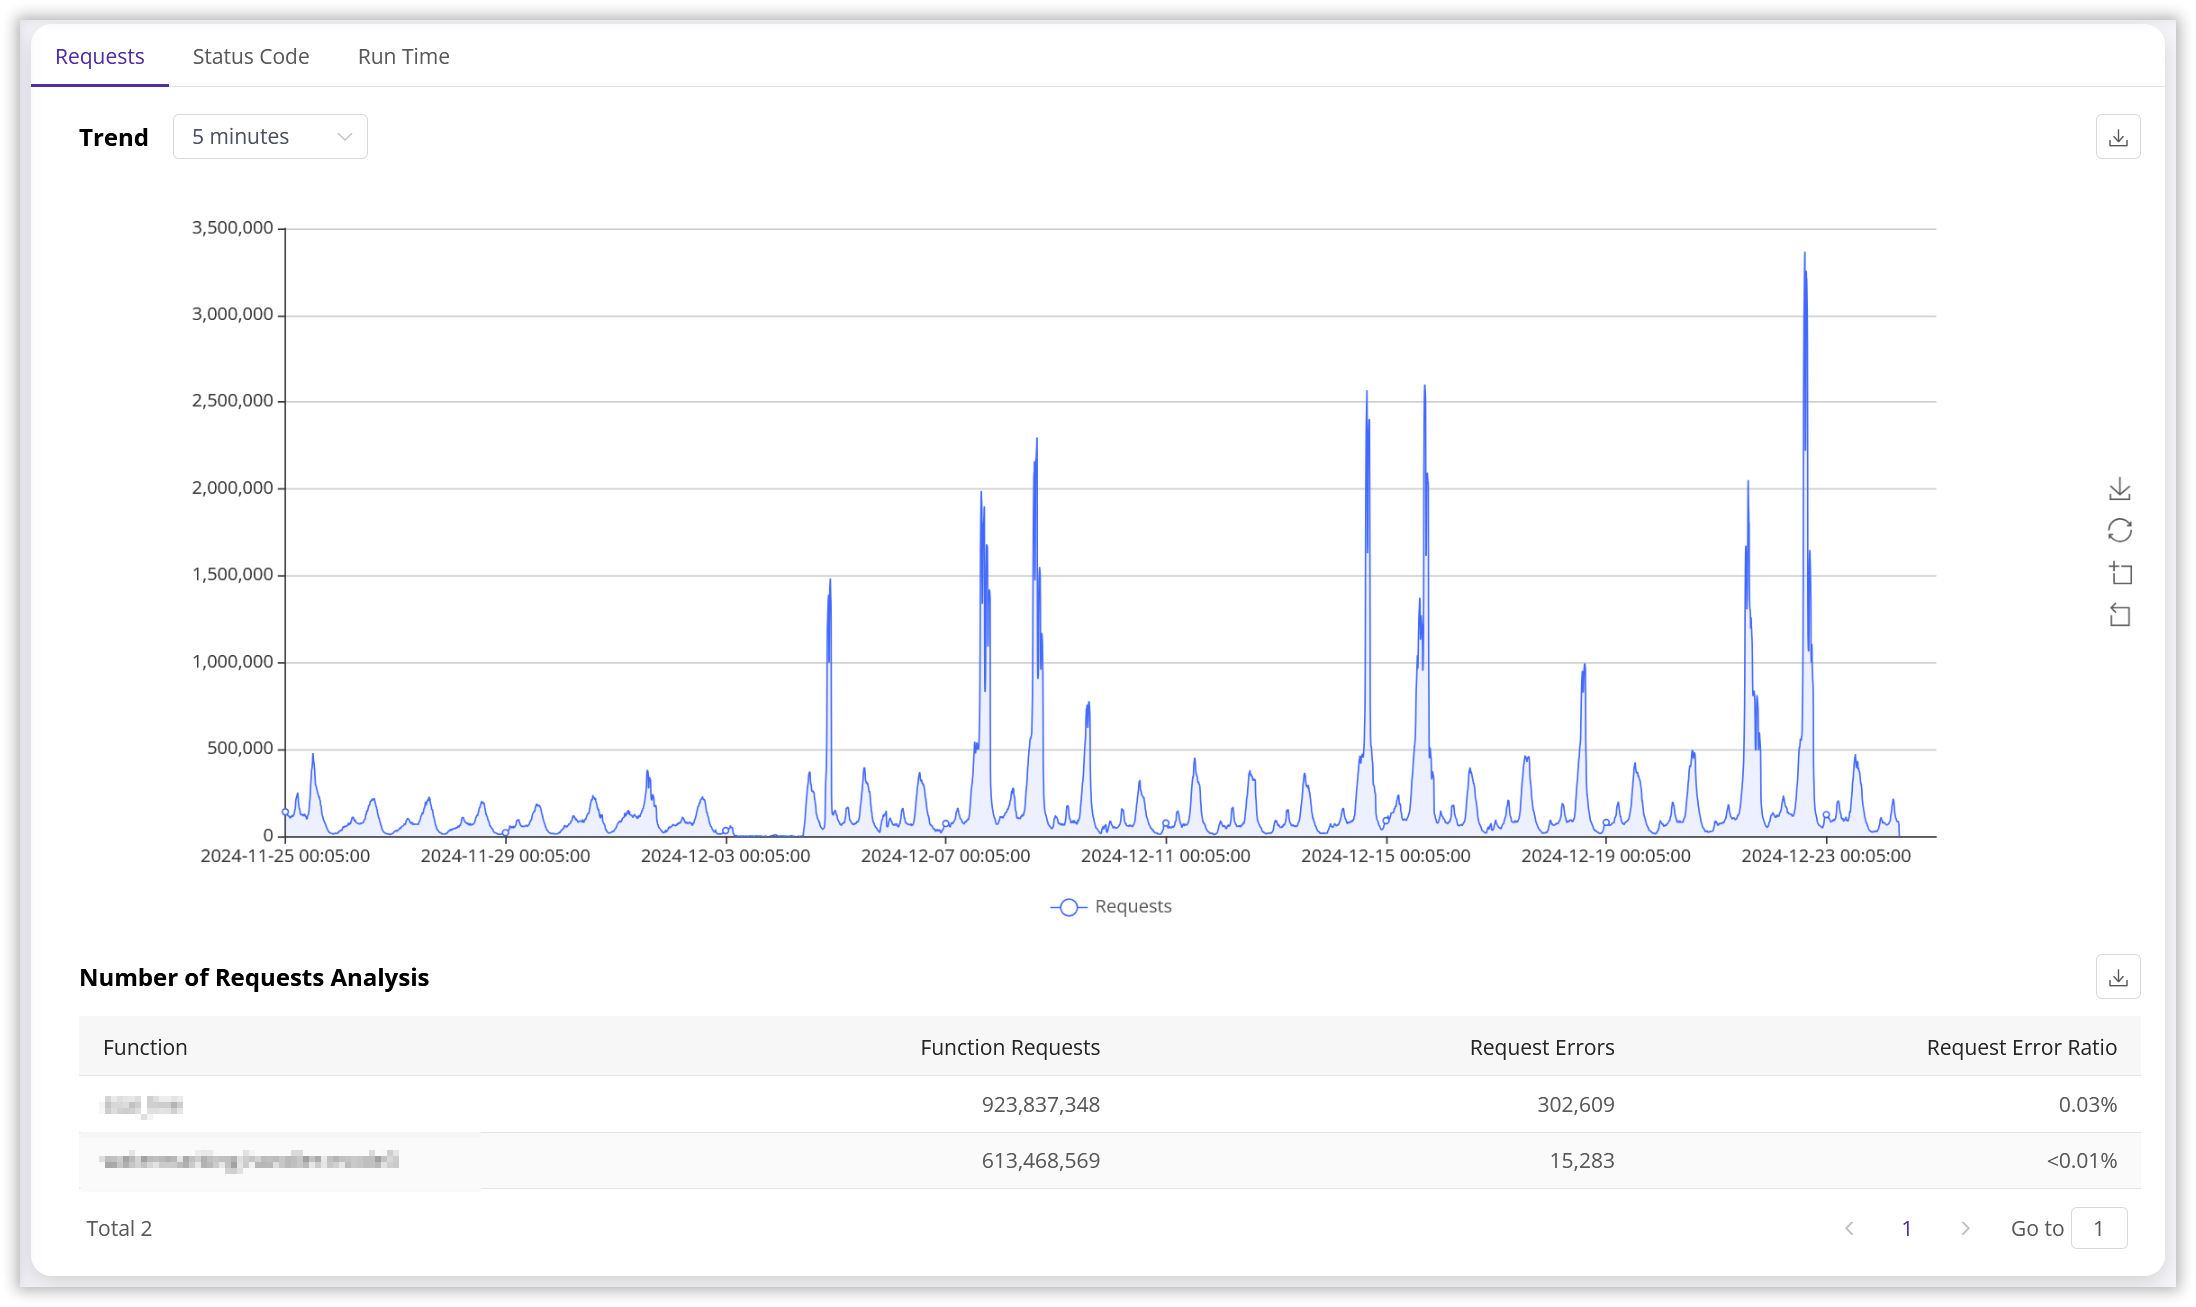
| Metric | Unit | Description |
|---|---|---|
| Function | - | The name of the function. |
| Requests | Count | The total number of requests made to the specific function. |
| Error Requests | Count | The total number of requests to the specific function that resulted in 4xx or 5xx HTTP status codes. |
| Error Rate | % | Error Rate = (Error Requests / Requests) * 100% |
3. Status Code Analysis
View status code trends with a granularity of 5 minutes, 1 hour, or 1 day.
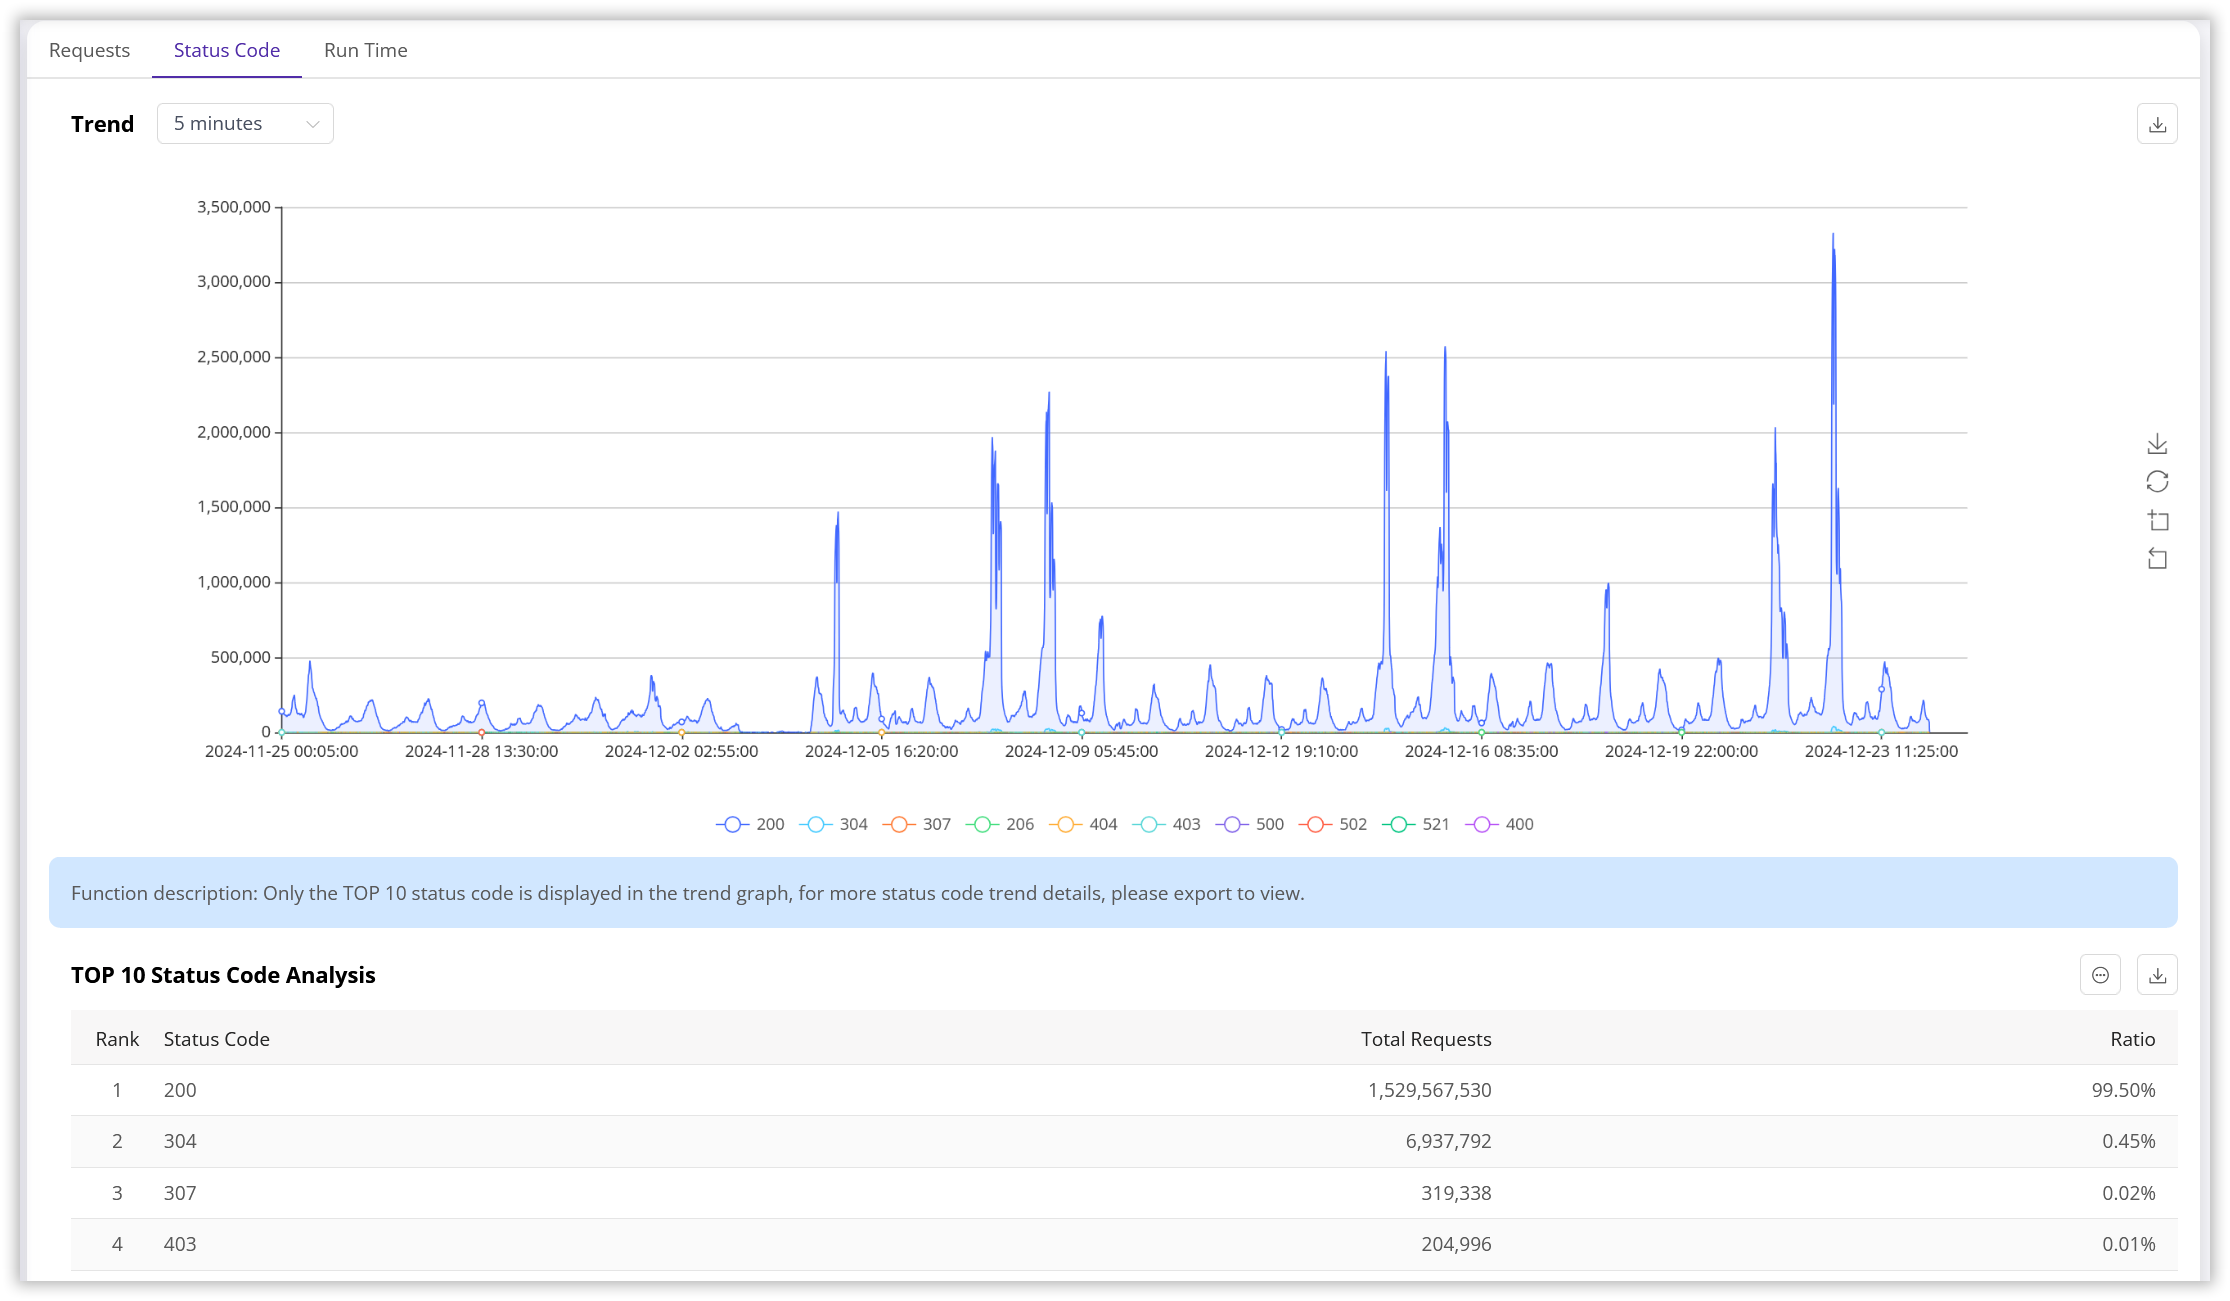
| Metric | Unit | Description |
|---|---|---|
| Rank | - | The rank of the status code by frequency of occurrence, from highest to lowest. |
| Status Code | - | The HTTP status code returned by the function. |
| Requests | Count | The total number of requests for a specific status code. |
| Percentage | % | Percentage = (Requests for this status code / Total requests for all functions under the filter) * 100% |
4. Runtime Analysis
View runtime trends with a granularity of 5 minutes, 1 hour, or 1 day.
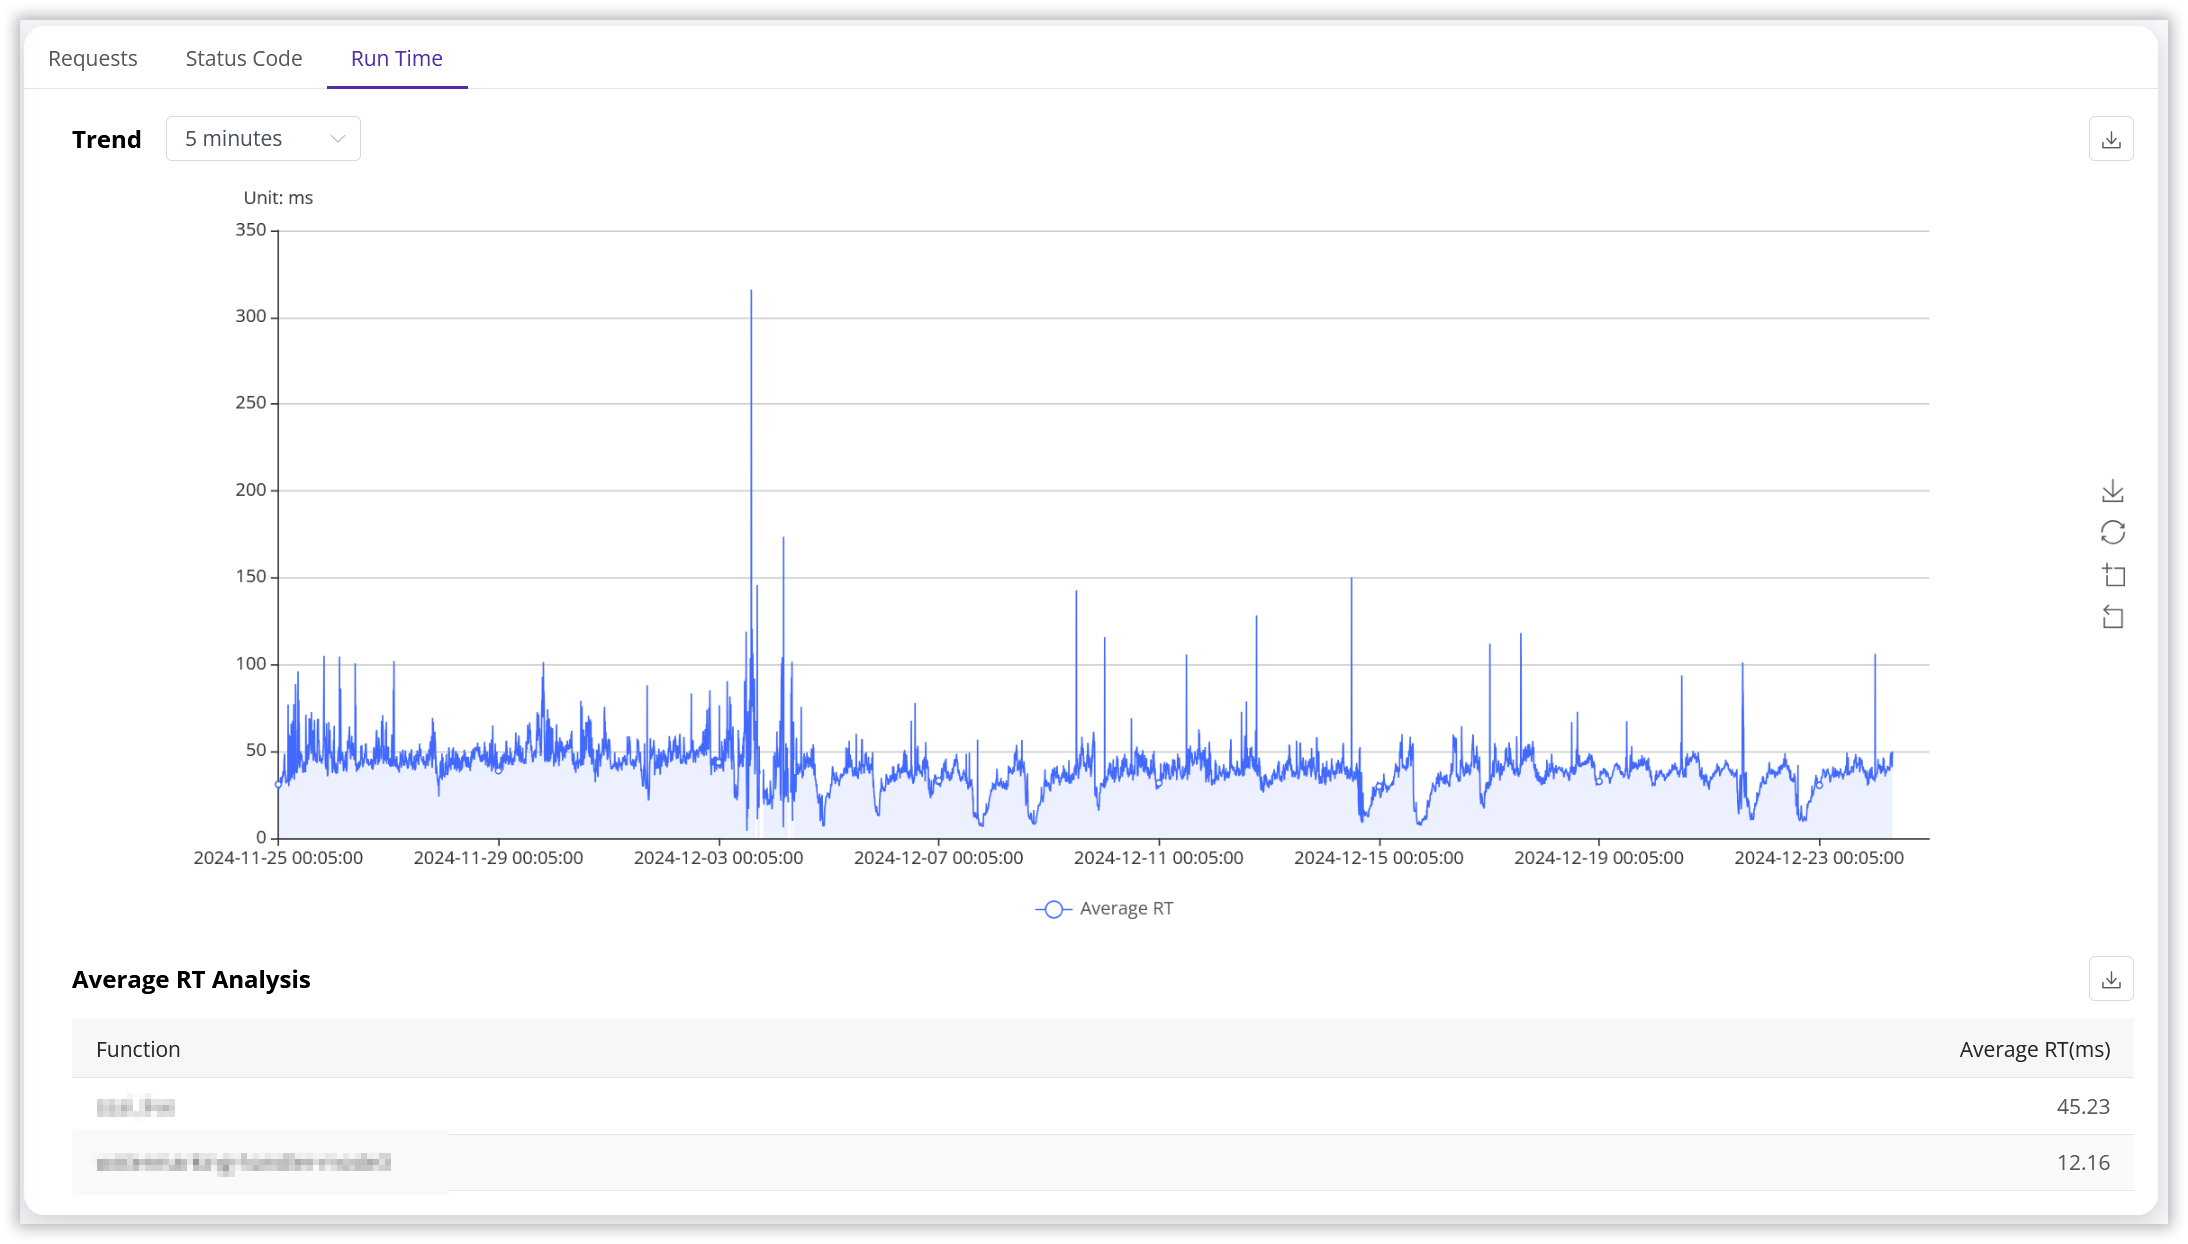
| Metric | Unit | Description |
|---|---|---|
| Function | - | The name of the function. |
| Average Runtime | ms (milliseconds) | The average runtime for the selected function within the specified period, calculated as the function’s total runtime divided by its total number of requests, rounded to two decimal places. |
Is the content of this document helpful to you?
Yes
I have suggestion