Storage
Last update:2022-06-24 15:42:20
• Entrance
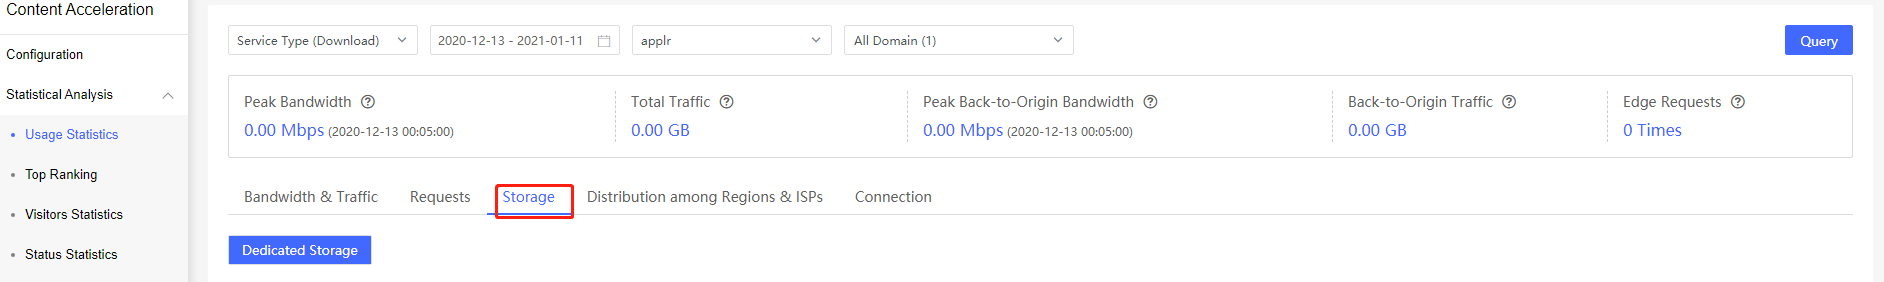
Product → Statistical Analysis → Usage Statistics → Storage
• Introduction
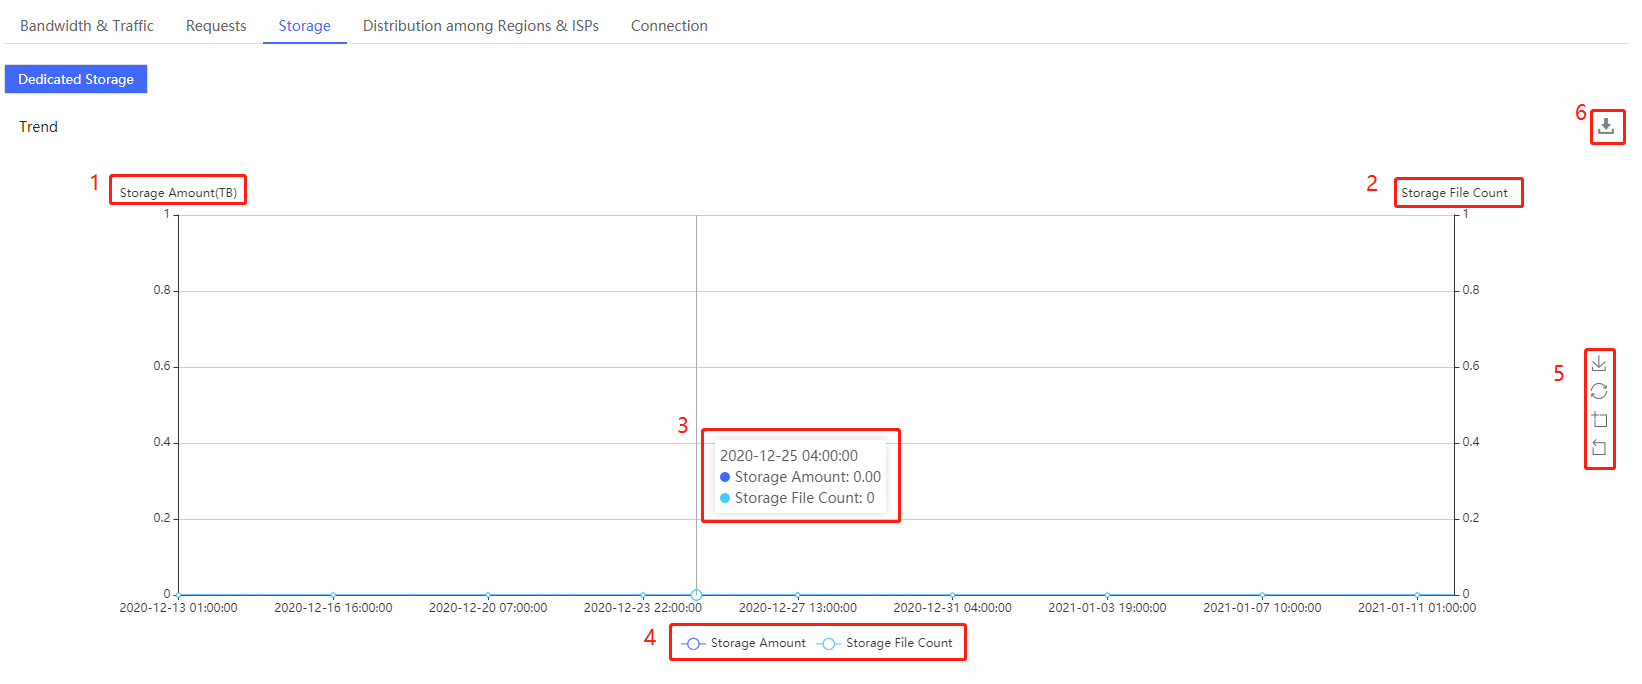
In storage, you can inquire about the dedicated caching amounts and files count in granularity of 3-hour level in terms of trend and daily data. Data generated within 2 years is traceable farthest, while the maximum query time period is 31 days.
• Trend
A line chart with 2 verticals axes, which are storage amount in TB (1) and storage file count (2), and a horizontal axis of time is displayed for revealing the trend of dedicated caching amount and files count. Similarly, when mouse is on the chart, a floating window (3) will emerge with data point details. If only storage amount or file count is desired, you can diminish the corresponding vertical axis and line by deselecting its label (4). Additionally, function icons can help you to save the chart as a picture, zoom in, unzoom and reset the chart. Data exporting is available here.
• Daily Data
Storage amount and storage file count is listed on a daily basis here. Data contained here can be exported as well.
