Requests
Last update:2022-06-24 15:42:23
• Entrance
Product → Statistical Analysis → Usage Statistics → Requests
• Introduction
Requests reveals the details of requests from the edge and origin servers made by accelerated domains over time. Besides, it also offers statistics of peak and average utilization, as well as total data transferred during the query time. It has 2 components, which are trend and daily data.
Both edge and origin requests have common query criteria as time, control-groups and domains, among which time is restricted to date ranges that span 1-31 days, and conquerable time range is 2 years farthest.
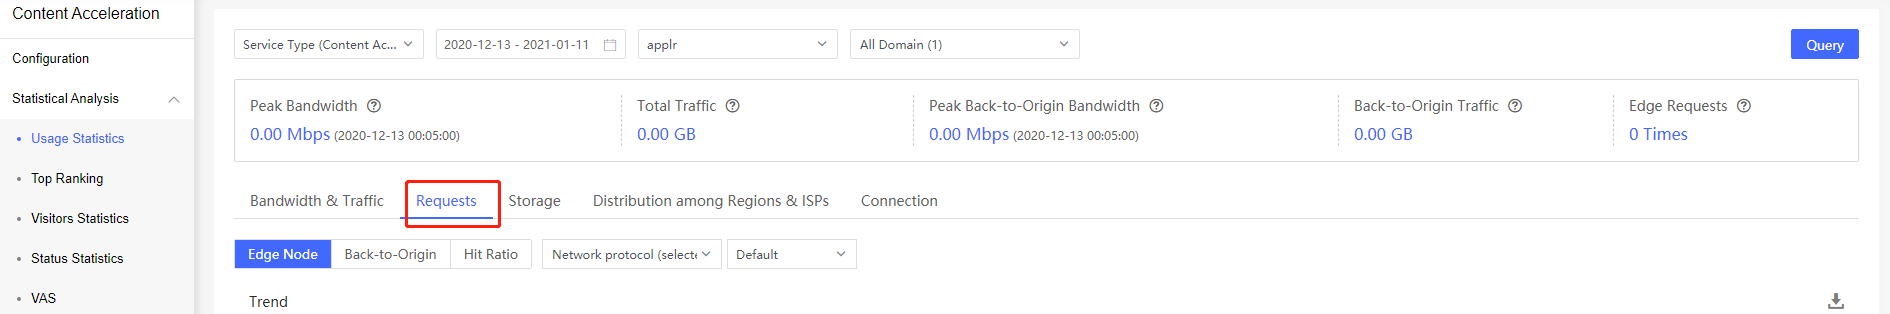
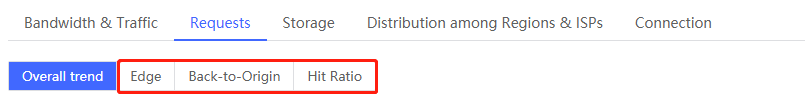
1 Overall trend
This chart contains the data of edge,back to origin and hit ratio. Here you can see the trend comparison chart of the four types of data.
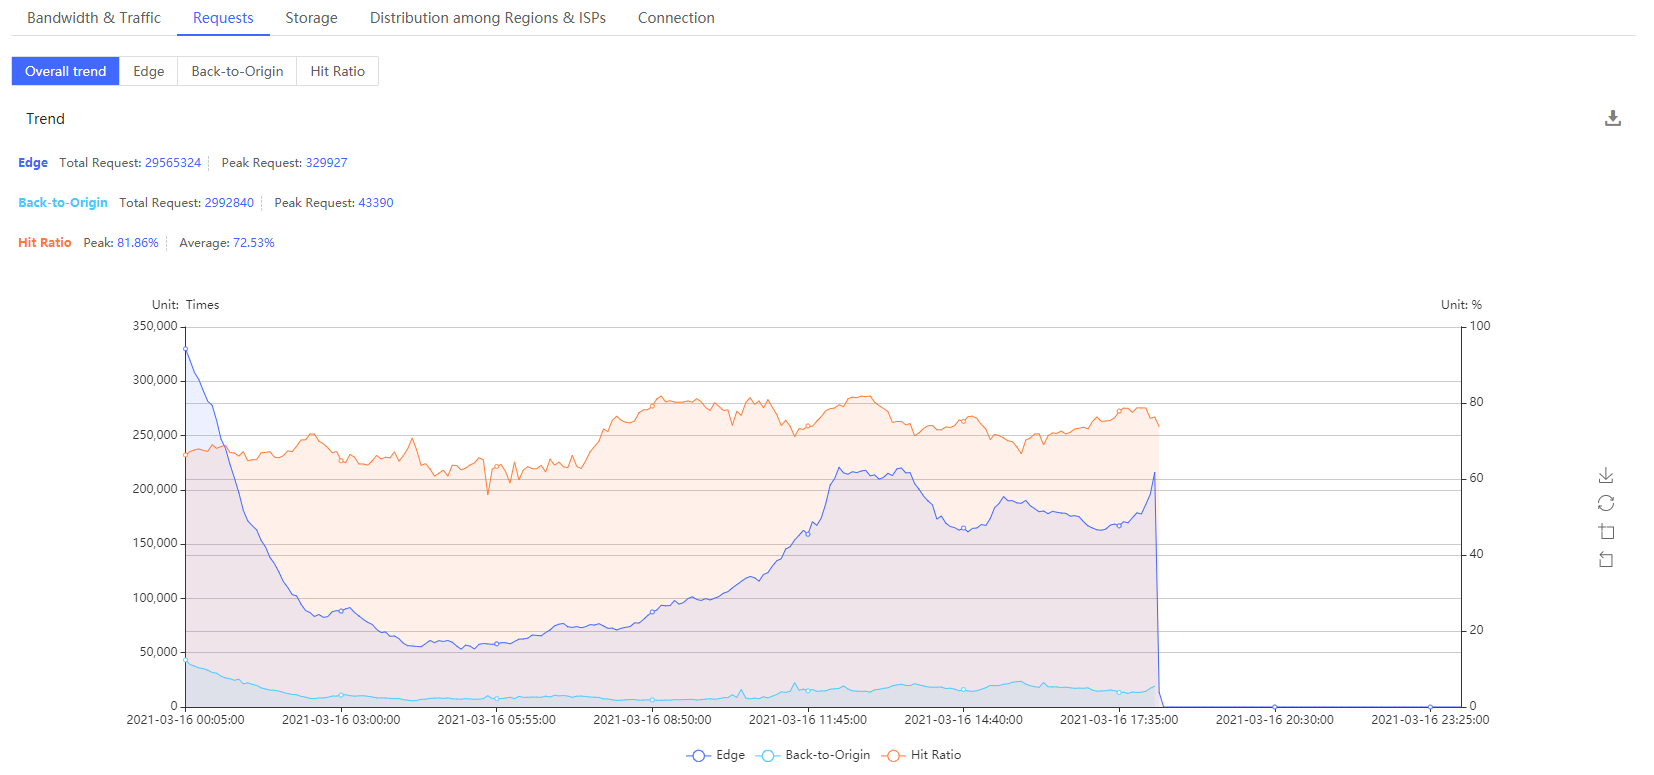
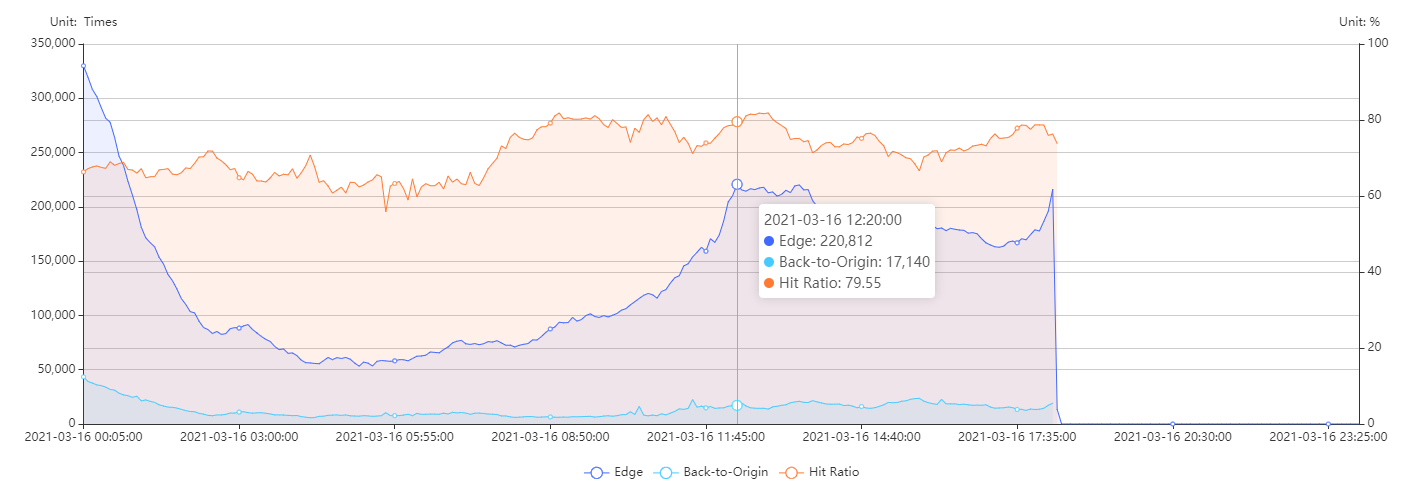
When mouse approaches to the chart, a floating window will show up for reveal the details of the data point.
It should be noted that when the query time range is within one day, the chart data granularity is 5 minutes, and the bandwidth peak is displayed. When the query time range is beyond one day, the data granularity is 1 hour, and the bandwidth peak is not displayed,and you can check the billing value or 5-min level data over 1day in subdivision tab
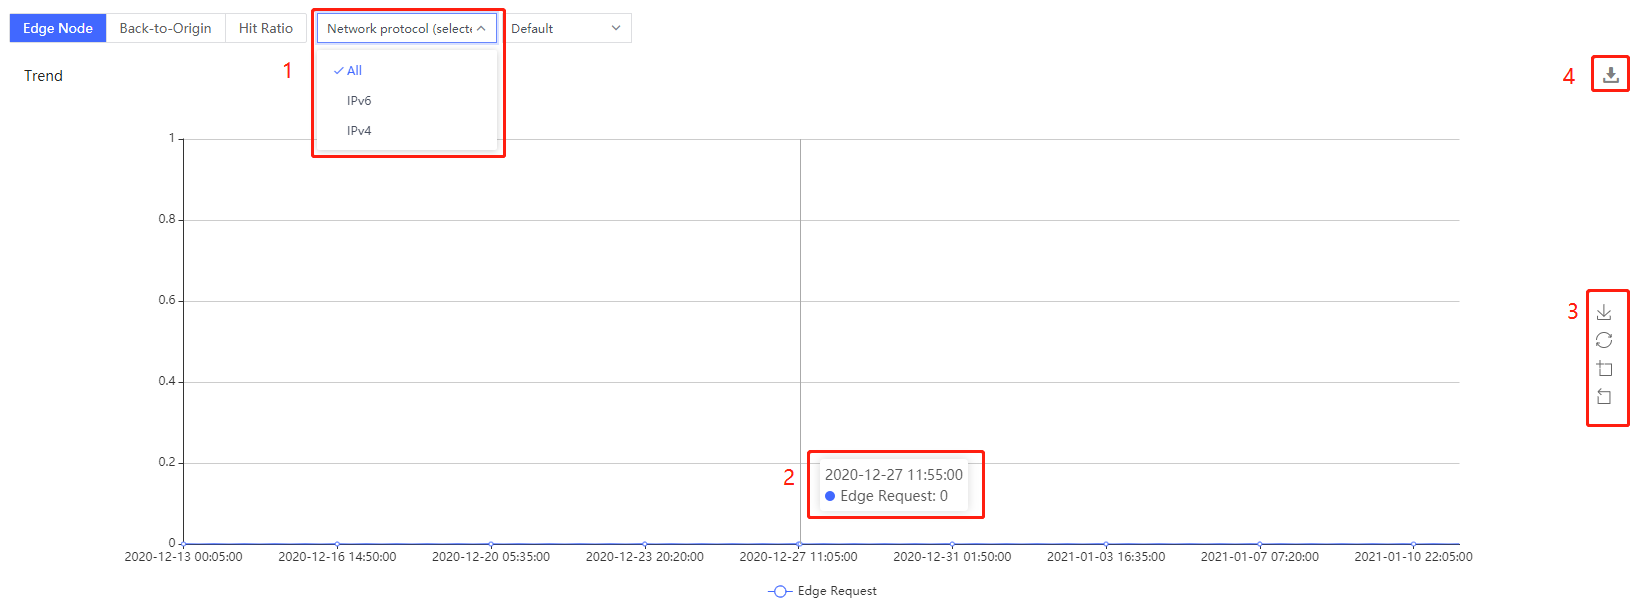
2 Edge Request
Edge request provides edge request trend and daily data. Total edge request is the gross request made by query domains to edge servers during the given time. A private query is presented here for distinguishing different network protocols as Ipv4 and Ipv6, which is determined by the IP of visitors.
• Trend
The line chart presents the trend of requests from edge servers on a time basis and will adjusts itself according to protocols selected in private query criteria (1). When mouse approaches the line, detailed information about the data point will be shown in a floating window. Moreover, you are able to save the chart as a picture, as well as reset, zoom in and unzoom the chart. Data export is also available here.
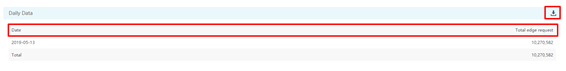
• Daily Data
Daily data records total edge requests of everyday within the query time and is listed in a descending order in the light of date. Data here can be exported if is needed.

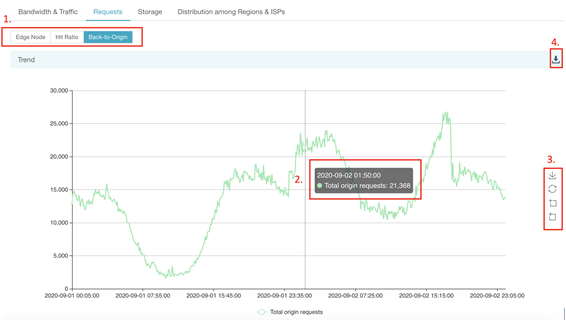
3 Origin Request
Origin request provides the trend and daily data of requests to origin servers by given domains in query time.
• Trend
The same as edge request trend, you can check the details of origin requests by approaching mouse to the line (1), zooming in and unzooming the chart (2), saving the chart as a picture (2), or downloading the data (3).
• Daily Data
Daily data contains the data of total origin requests every day and also allows you to export it.
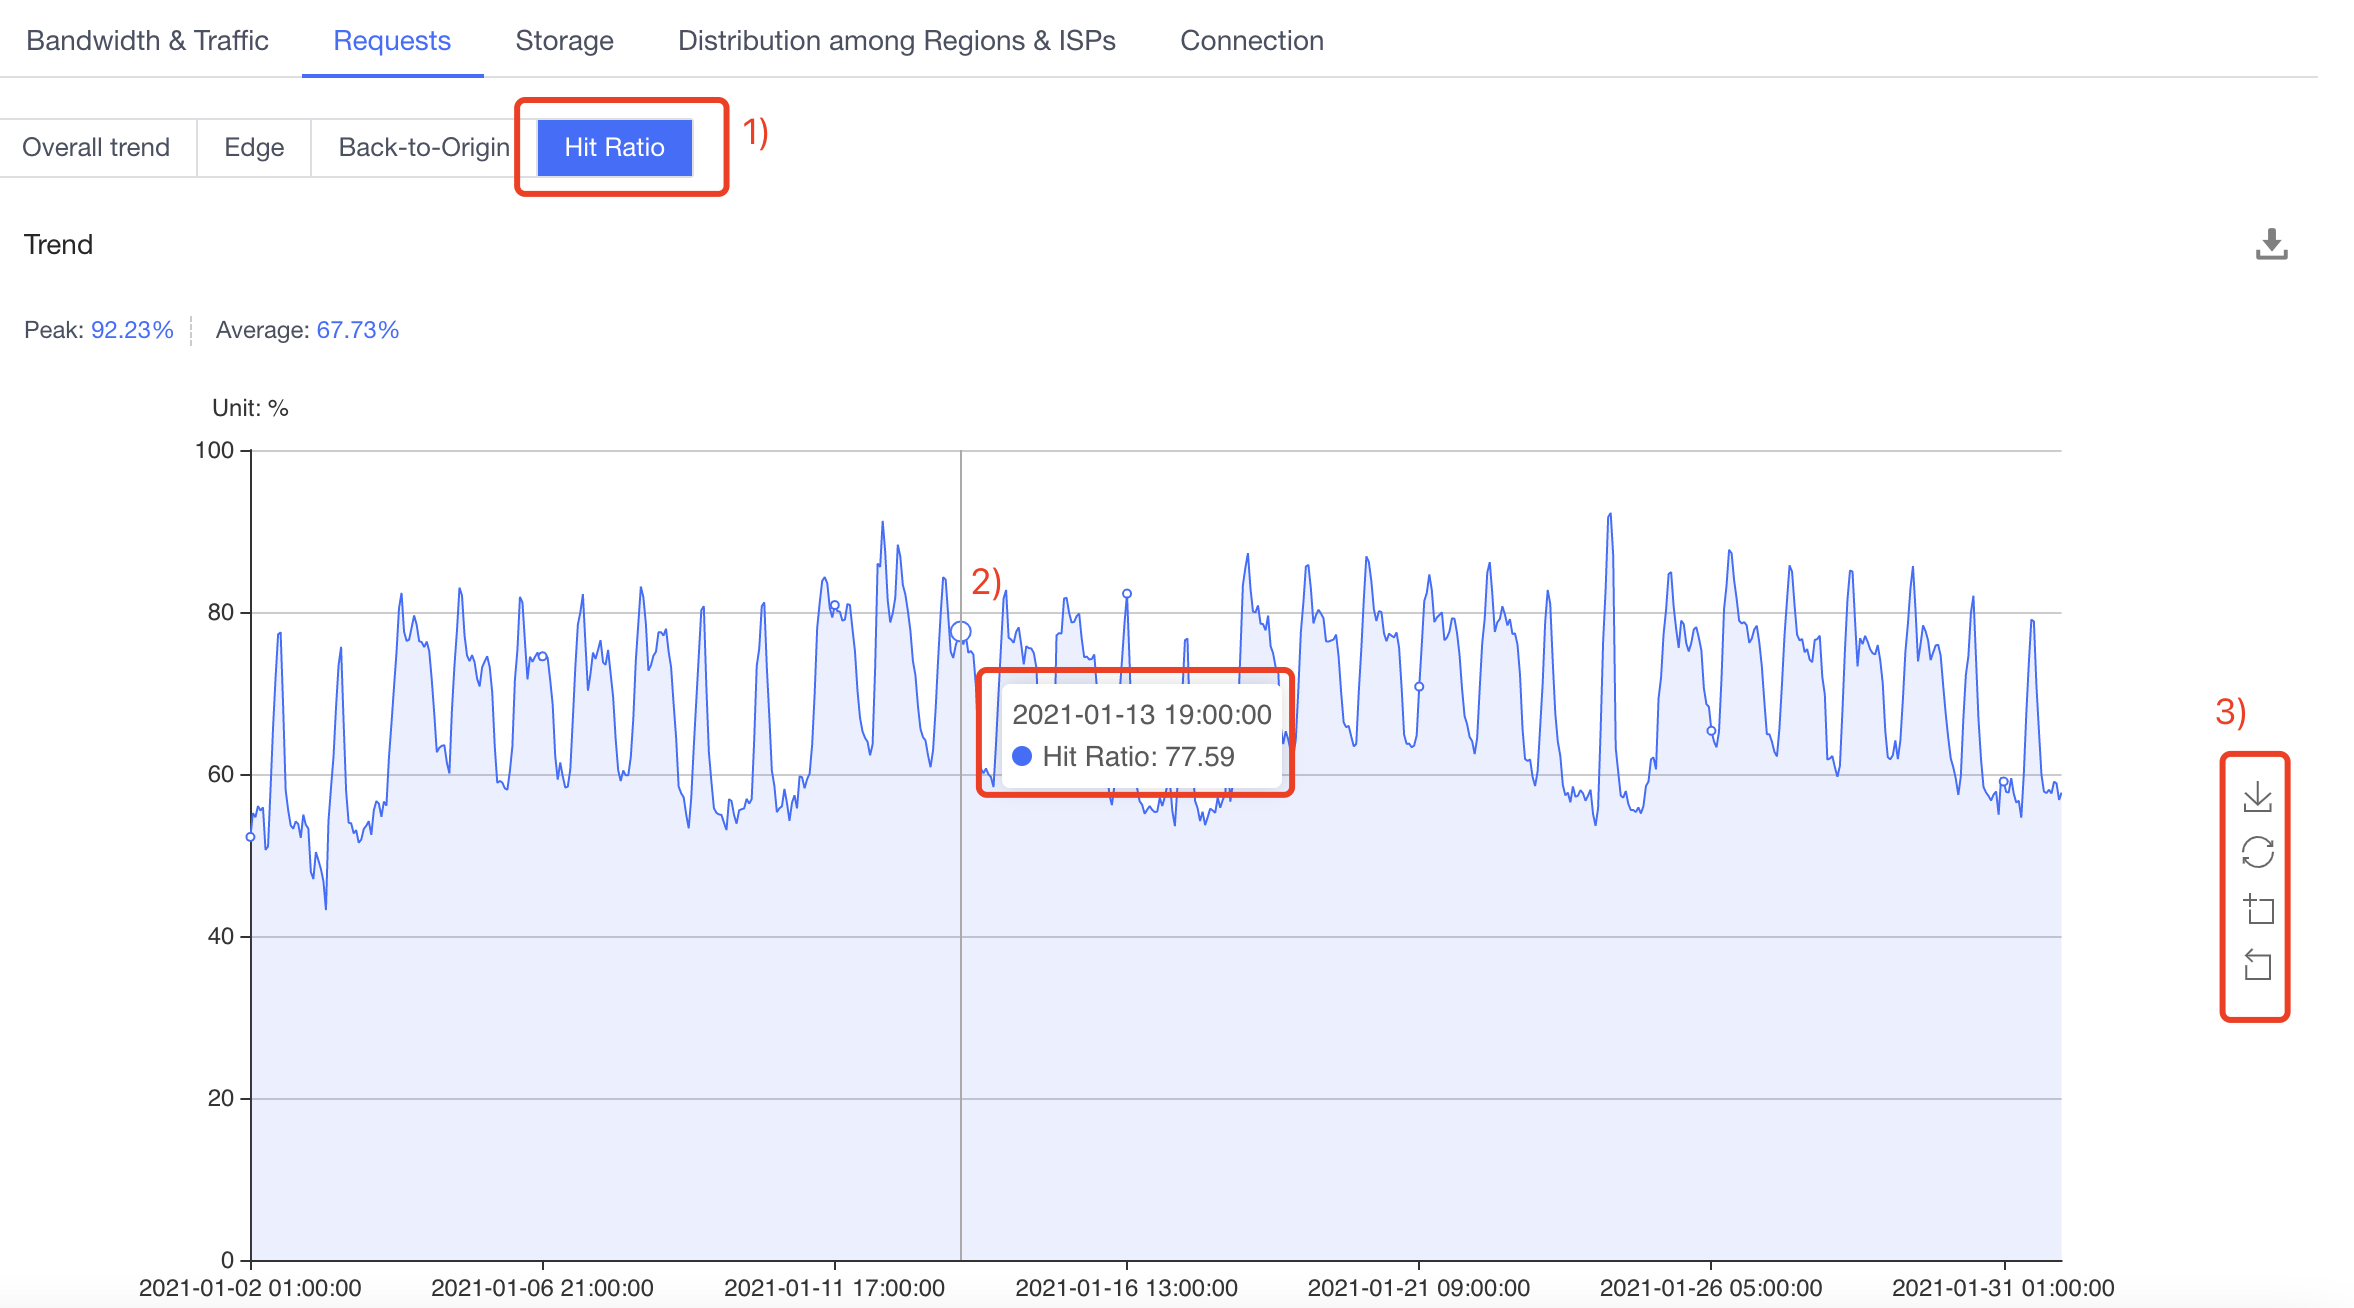
4 Hit Ratio
Hit Ratio provides the trend and daily data of requests to origin servers by given domains in query time.
• Trend
The same as edge request trend, you can check the details of Hit Ratios by approaching mouse to the line (1), zooming in and unzooming the chart (2), saving the chart as a picture (2), or downloading the data (3).
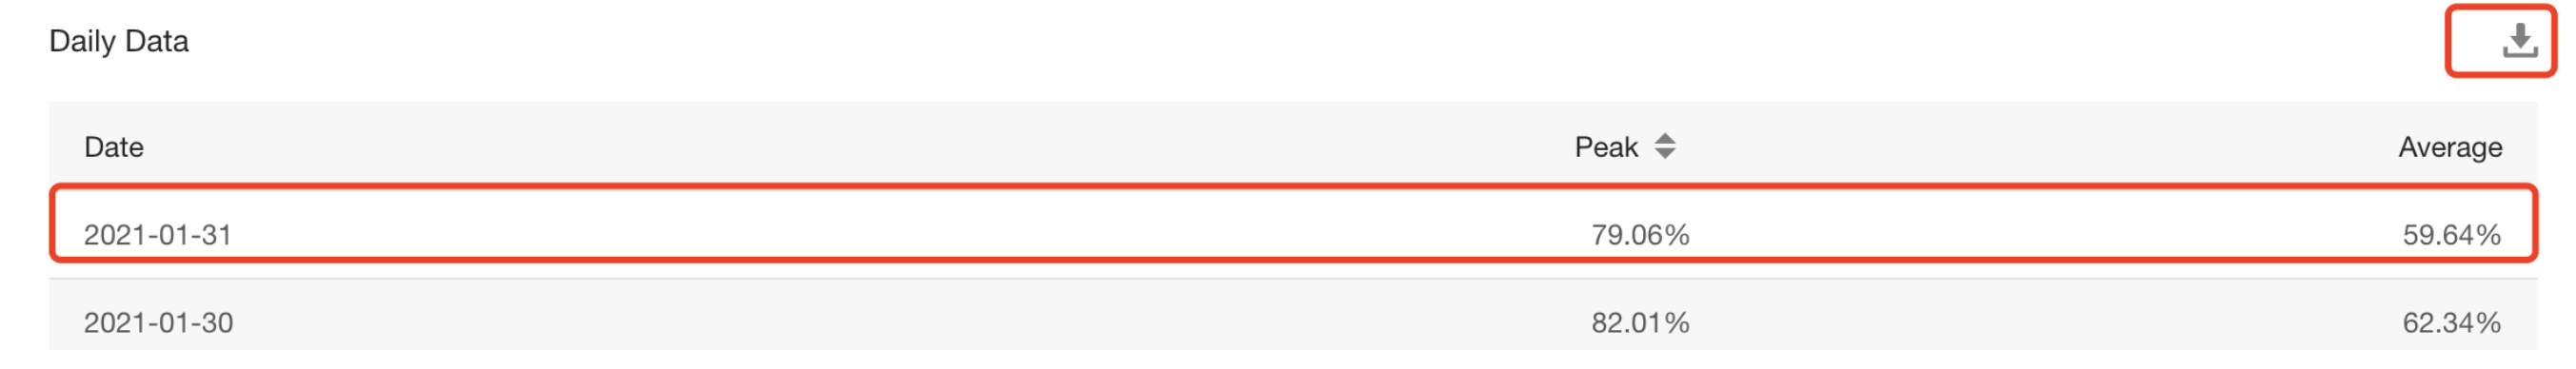
• Daily Data
Daily data contains the data of total Hit Ratios every day and also allows you to export it.