View and Manage Visual Reports
Last update:2026-03-30 17:30:59
The visualized reports display business data in chart form and support filtering by criteria such as time dimension, business type, service group, domain, etc. Two modes are available: Common Reports and Custom Reports.
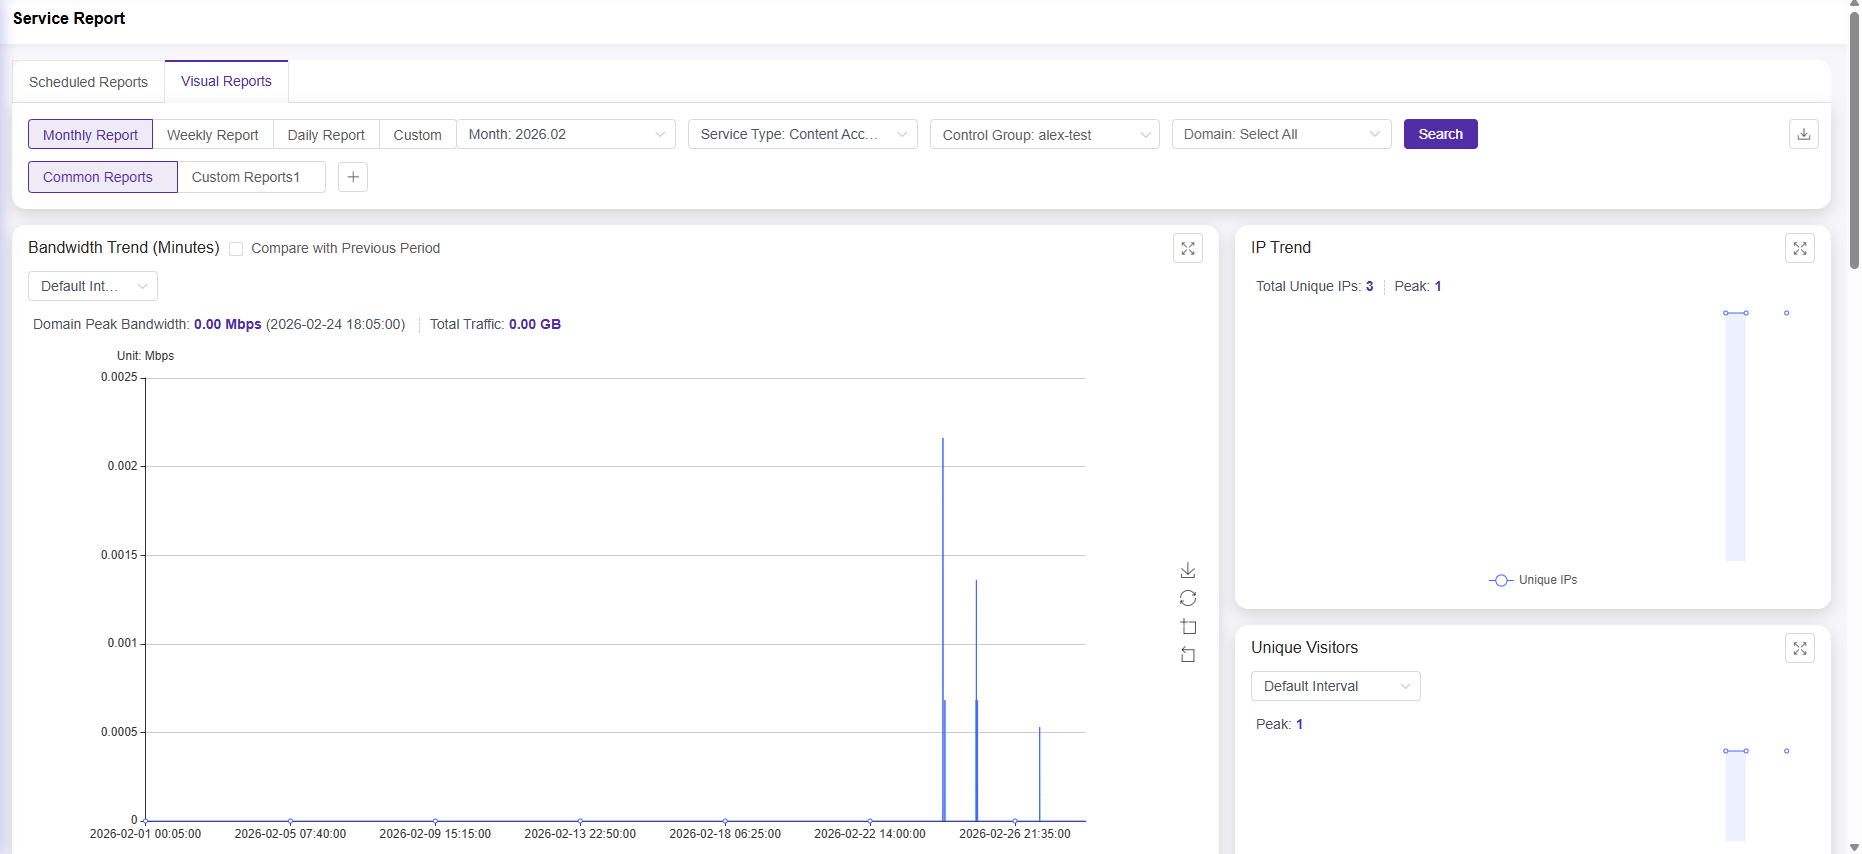
Filter Criteria
After setting the filter criteria at the top of the page, click Search to view the report data.
| Parameter | Description |
|---|---|
| Time Dimension | Select the time granularity for the report: - Monthly Report: Query by calendar month - Weekly Report: Query by calendar week - Daily Report: Query by calendar day - Custom: Manually select the start and end date |
| Business Type | Select the business type you want to view. The list shows the business types currently enabled under your account. |
| Service Group | Select the service group. The list shows the service groups currently maintained under your account. |
| Domain | Select the domain(s) to view. Multiple selections are supported; all are selected by default. |
Export Report
Click the download icon in the upper right corner of the page to export the current visual report in the following formats:
- Image and text report format (.doc)
- Data Summary Details Format (.xlsx)
General Report
The general report provides a default set of chart cards for the current business type. The chart cards displayed vary depending on the business type.
Each chart card supports fullscreen viewing. Some charts also support switching data granularity and comparing with the previous period.
Custom Dashboard
Custom views allow you to freely choose combinations of chart cards to create a personalized data dashboard. Custom views are only visible to the account that created them.
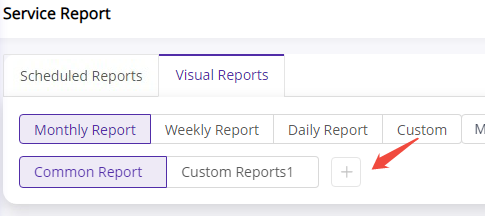
Create Custom Dashboard
- Click the General Report tab and then click the + button next to it.
- Enter a Custom Dashboard Name and select a Business Type.
- In the list of chart cards on the left, select the data metrics you wish to display; the real-time preview of the card layout is shown on the right.
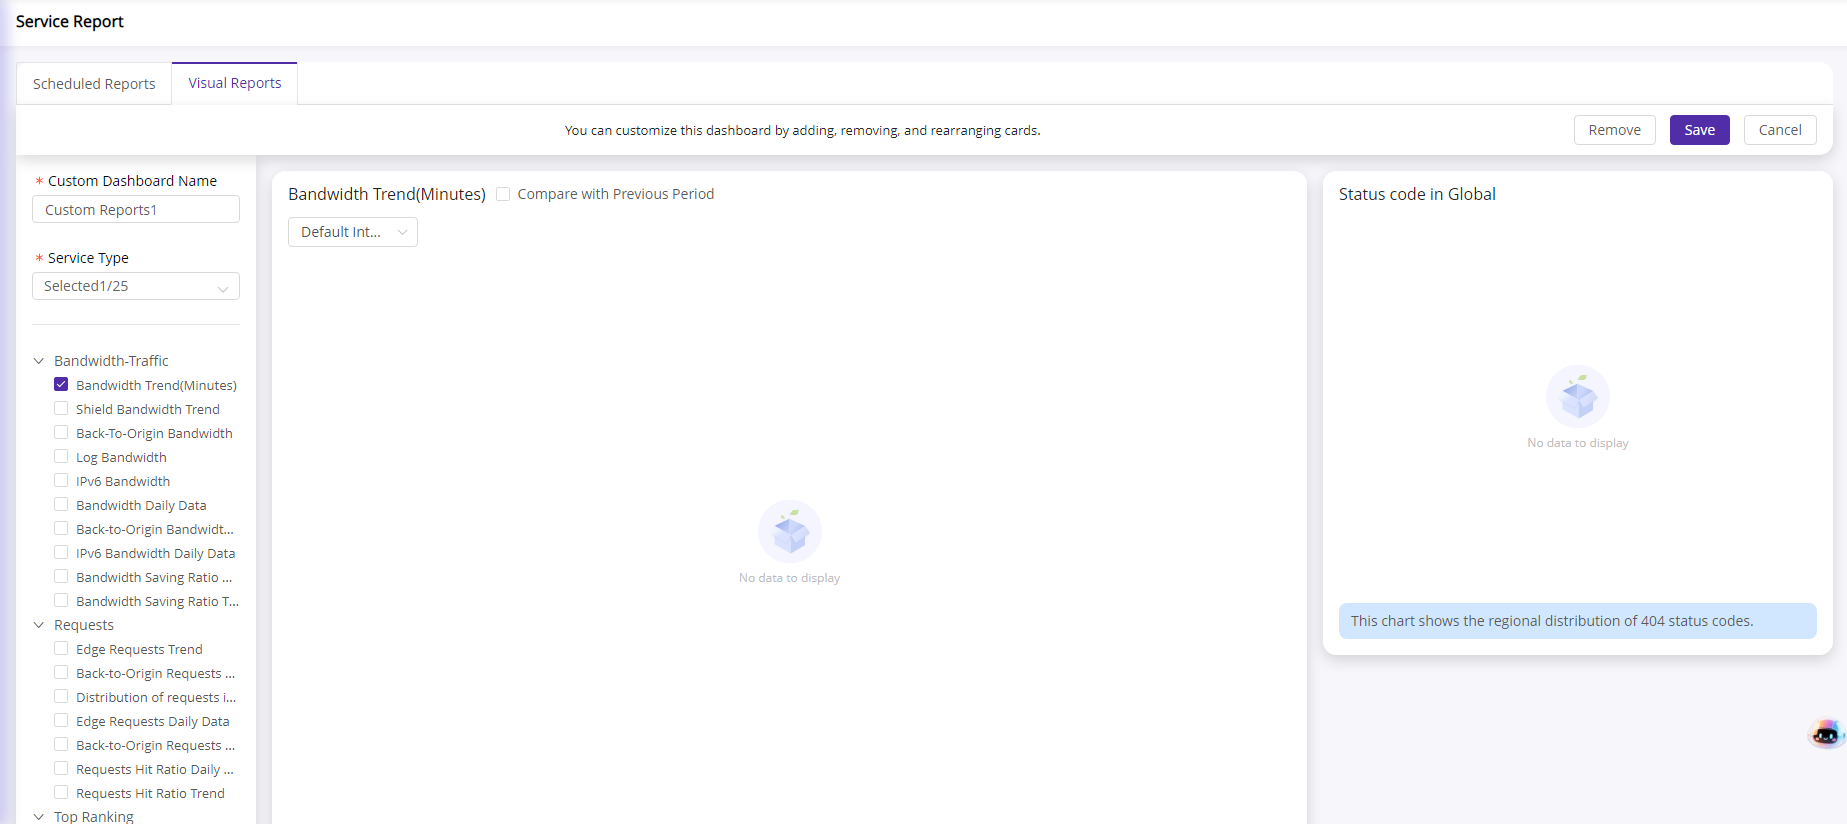
- Click Save to complete the creation.
Edit Custom Dashboard
Hover your mouse over the custom view tab, and click the edit button that appears. You can then add, delete, or move chart cards as needed. After making changes, click Save.
Delete Custom Dashboard
Hover your mouse over the custom view tab, and click the Delete button that appears to remove the view.