KV-Function Analysis
Last update:2024-12-25 15:54:02
This document explains how to use the CDNetworks console to view usage statistics for Edge KV operations triggered by Edge Cloud Apps functions associated with a specific domain. This helps you understand KV storage usage patterns within your functions. Note that the statistics presented here represent only the KV usage triggered by the specified functions, not the total usage of your KV namespaces.
Viewing Steps
- Log in to the CDNetworks Console, select Edge Application, locate the Edge KV menu, and click Function Triggered KV Analysis.
- Set the filter criteria and click Query. You can combine the following criteria:
- Date Range: The time range for the data you wish to analyze.
- Function: The specific function that triggers KV operations.
- Domain: The domain associated with the function that triggers KV operations.
Metrics
Function Triggered KV Analysis provides data across three dimensions:
Overview
This overview displays key metrics for the selected time range, function, and domain.
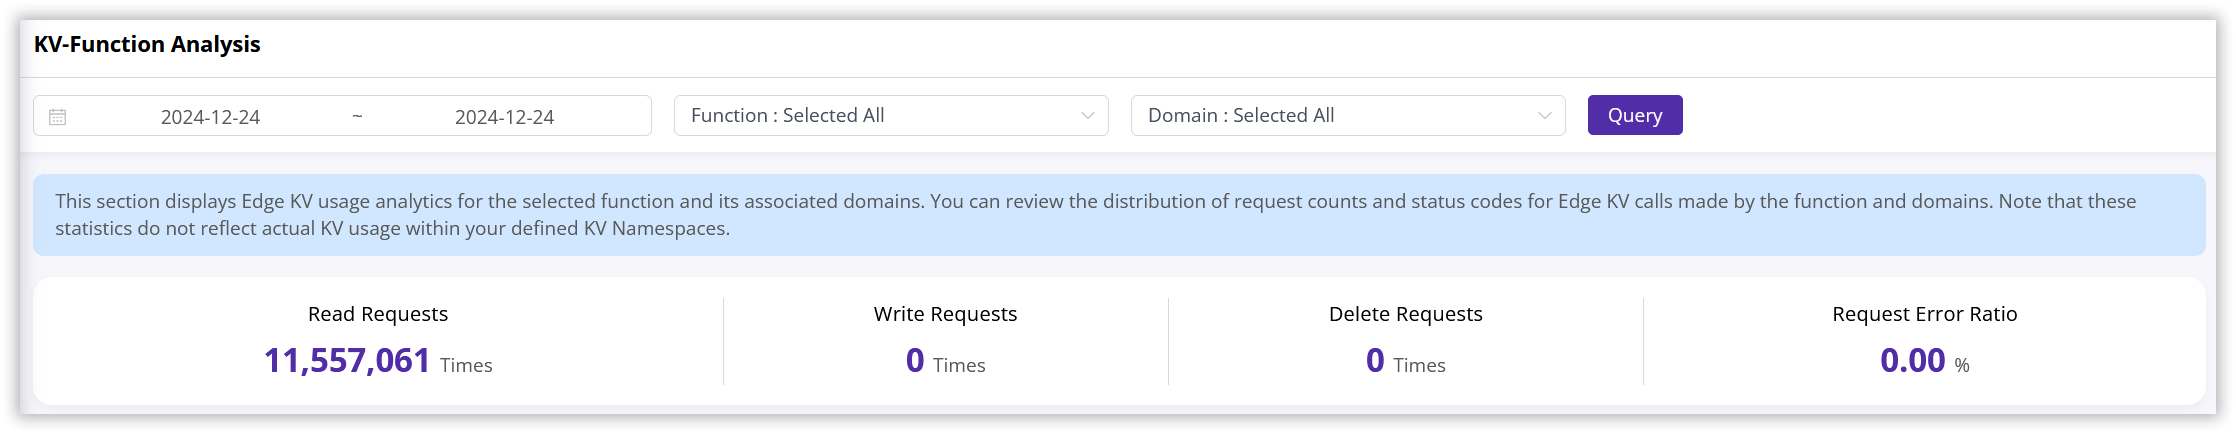
| Metric | Unit | Description |
|---|---|---|
| Read Requests | Count | Total read requests to KV storage triggered by the specified domain and its associated functions. |
| Write Requests | Count | Total write requests to KV storage triggered by the specified domain and its associated functions. |
| Delete Requests | Count | Total delete requests to KV storage triggered by the specified domain and its associated functions. |
| Error Rate | % | Error rate for KV operations triggered by the specified domain and its associated functions. Calculated as: (Error Requests / Total Requests) * 100% |
Request Analysis
This section displays trends in read, write, and delete requests to KV storage, triggered by the specified domain and its associated functions, over time. Data can be viewed at different granularities (5 minutes, 1 hour, 1 day).
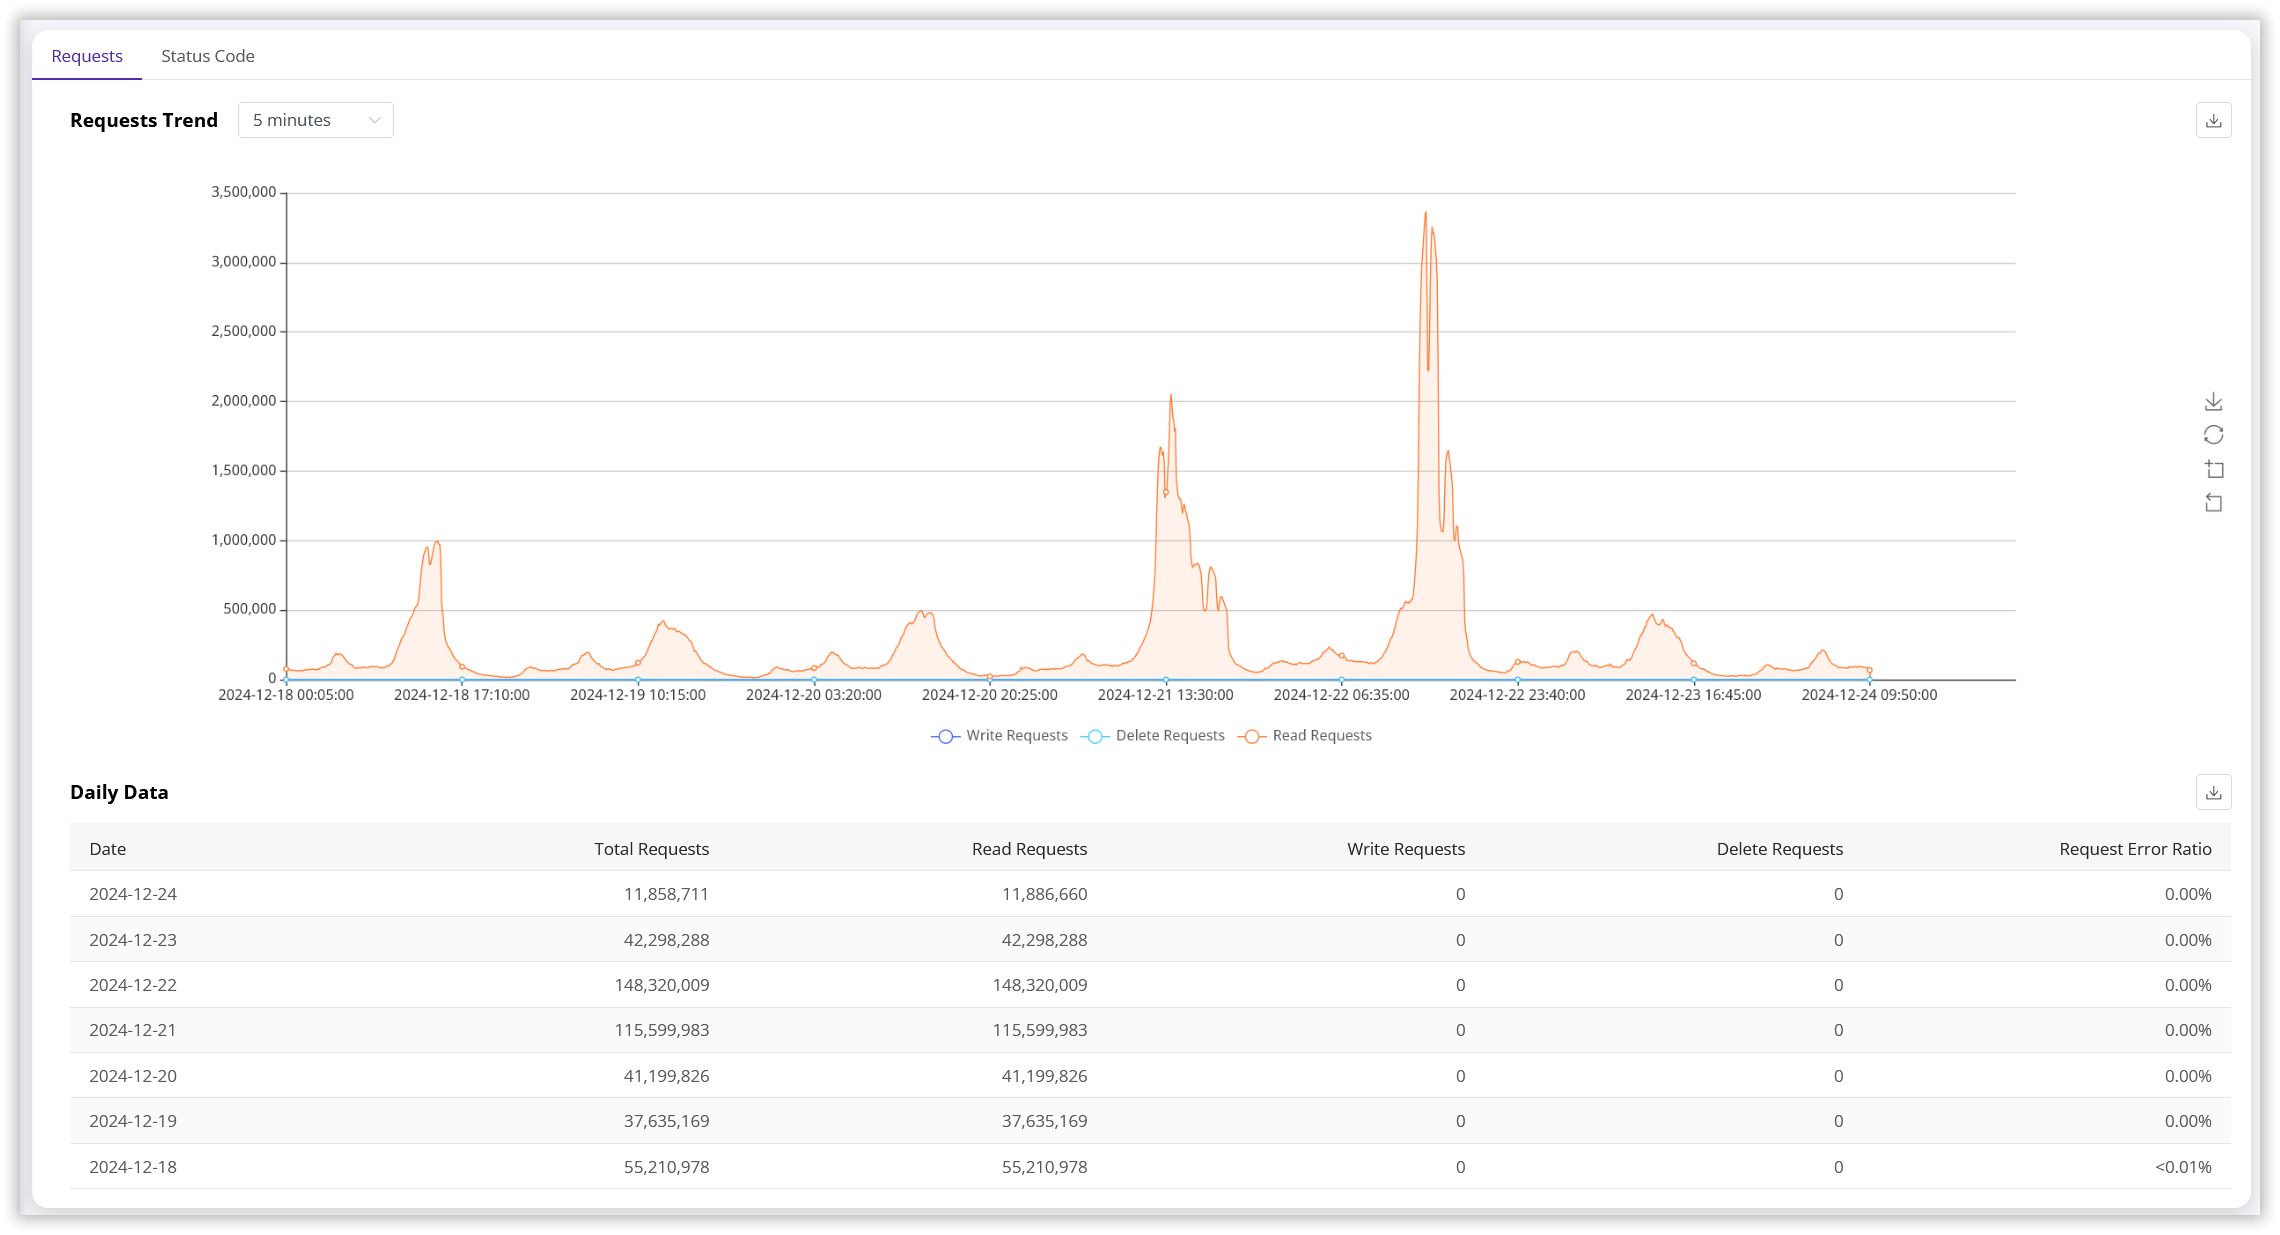
The table below the trend chart provides a daily breakdown of function-triggered KV analysis data for the selected time period and filter criteria.
| Metric | Unit | Description |
|---|---|---|
| Total Requests | Count | Total KV operations (read, write, and delete) triggered by the specified domain and its associated functions. |
| Read Requests | Count | KV read operations triggered by the specified domain and its associated functions. |
| Write Requests | Count | KV write operations triggered by the specified domain and its associated functions. |
| Delete Requests | Count | KV delete operations triggered by the specified domain and its associated functions. |
| Error Rate | % | Error rate for KV operations triggered by the specified domain and its associated functions. Calculated as: (Error Requests / Total Requests) * 100% |
Status Code Analysis
This section displays the trends of status codes returned by KV operations triggered by the specified domain and its associated functions. Data can be viewed at different granularities (5 minutes, 1 hour, 1 day).
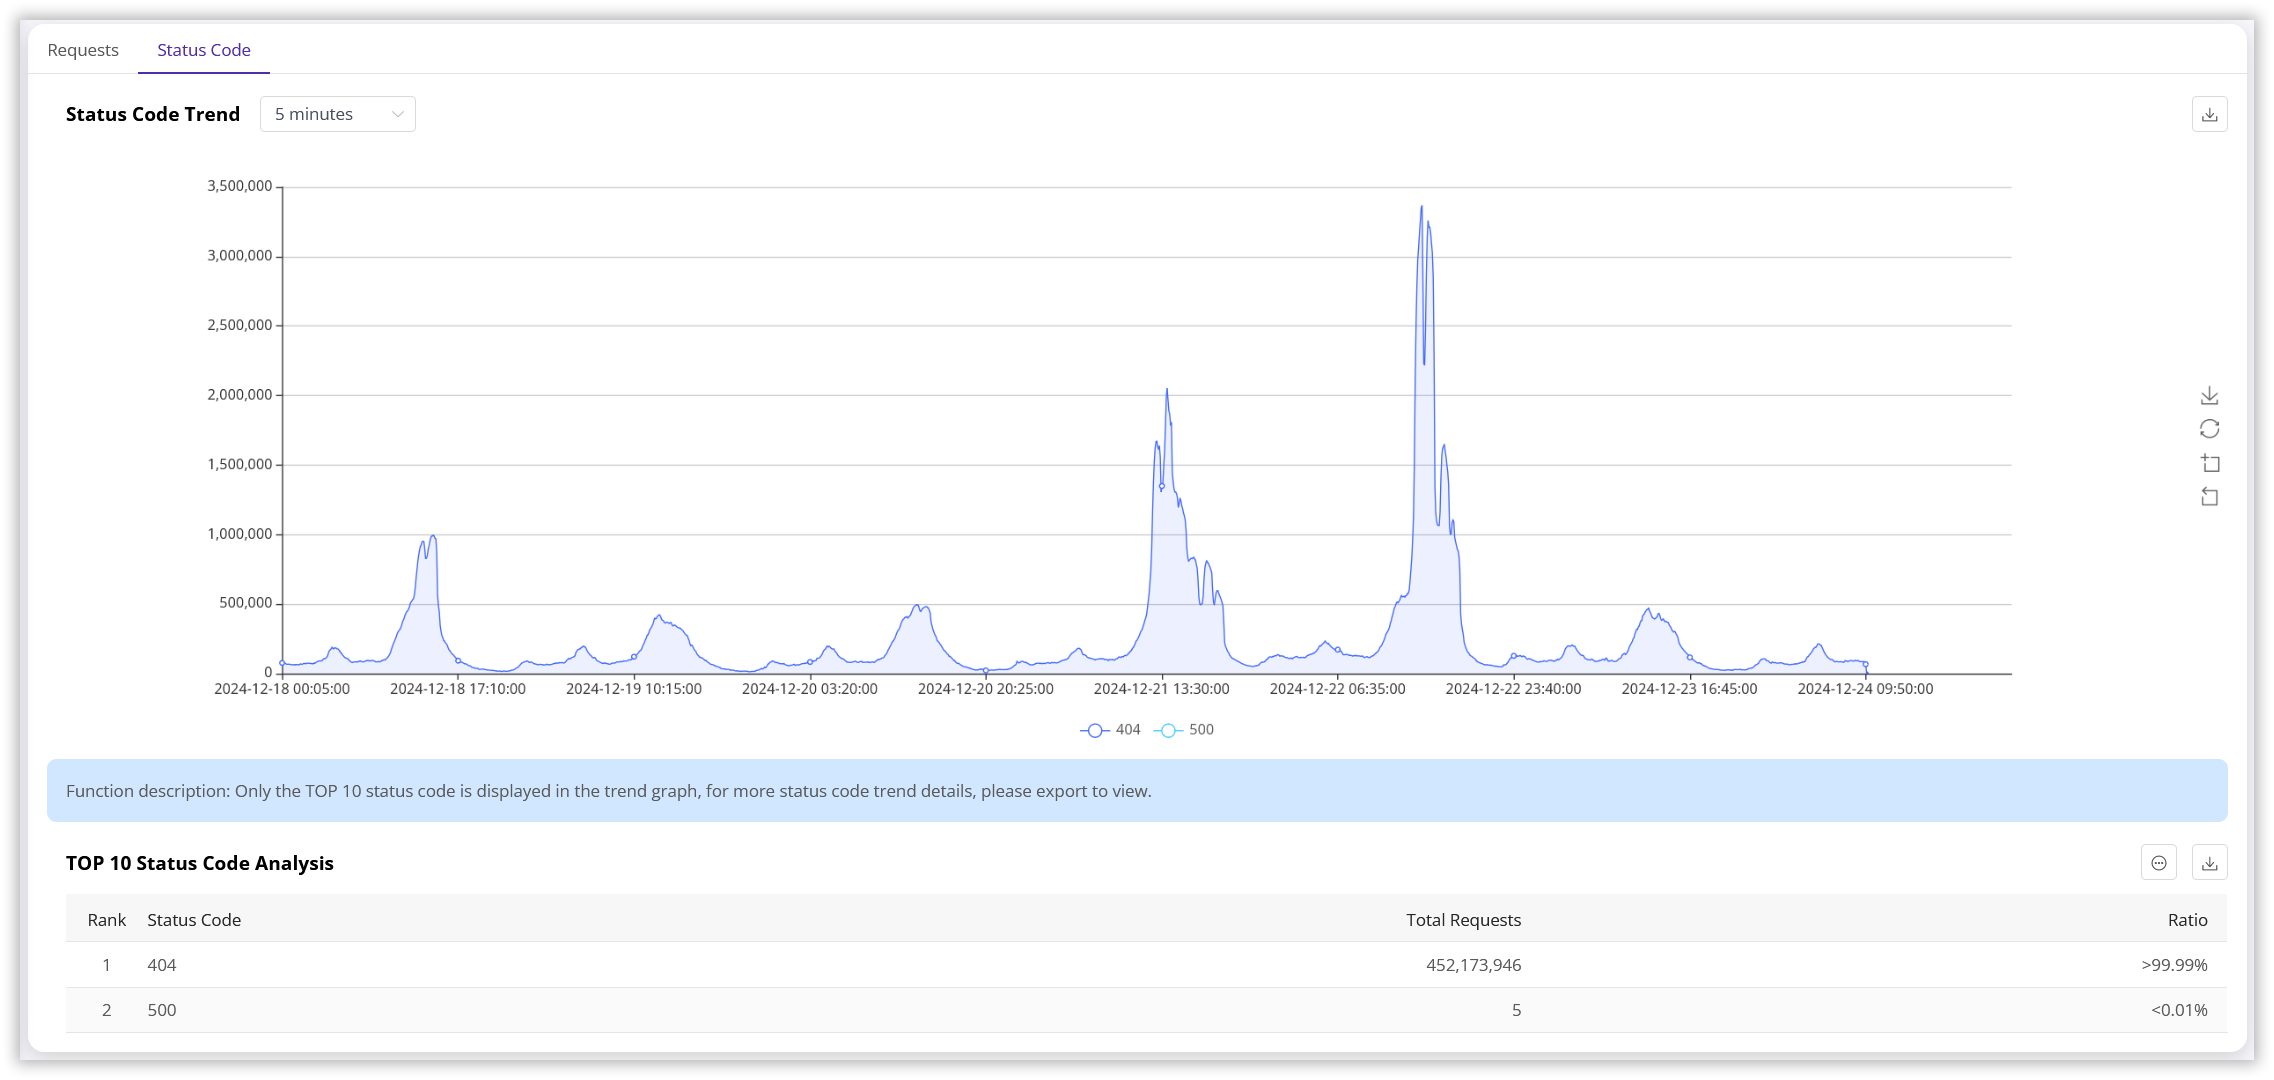
| Metric | Unit | Description |
|---|---|---|
| Rank | - | Rank of the status code by frequency of occurrence. |
| Status Code | - | The HTTP status code returned by the KV operation. |
| Requests | Count | Total number of requests for the corresponding status code. |
| Percentage | % | Percentage of requests for the corresponding status code. Calculated as: (Requests for this status code / Total Requests under the filter criteria) * 100% |