URL
Last update:2022-07-27 13:26:11
• Entrance
Product → Statistical Analysis → Top Ranking → URL
• Introduction
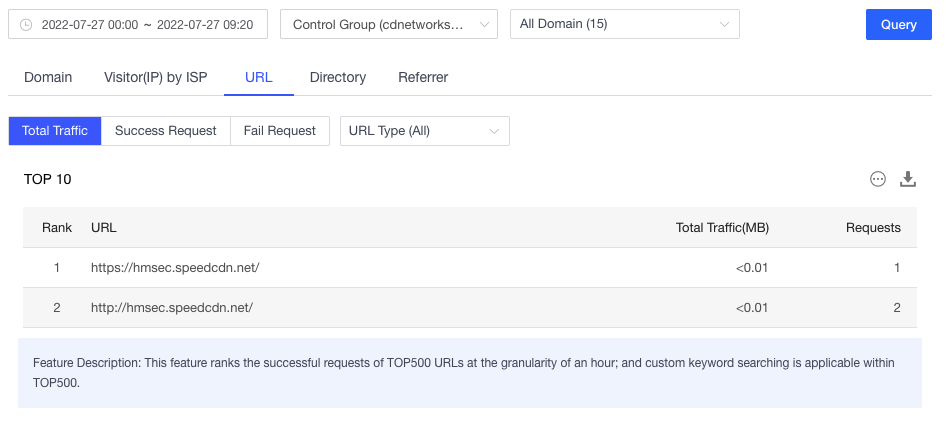
According to public query criteria as time range, domains and domain groups, as well as private query criteria as URL type including web, image, style, and custom URL searching strings, The table shows Ranked list of URL according to the number of edge requests by descending order. The table also shows corresponding total traffic (MB). For query, data generated within 2 years is traceable, while only query date that span 1-31days is acceptable for every single query. data granularity is in 1-hour level.

Top 10 URLs, in which query string is eliminated, are presented in the table by default. However, if top 200 URLs are desired, you can also check top 200 URLs and corresponding total traffic, hit and miss traffic, request, as well as number of different status code by pressing icon at the right corner of the table. Together there is a download icon for you to export data. The system differentiates hit and miss traffic by cache strings and distinguishes status code by status code strings.
• Total Traffic
The table of Total Traffic shows TOP 10 URL requests and total traffic correspondingly as default. for further details, you are able to check the total traffic and requests of top 200 URLs when you click  or
or  on the upper right of the table.

• Success Request
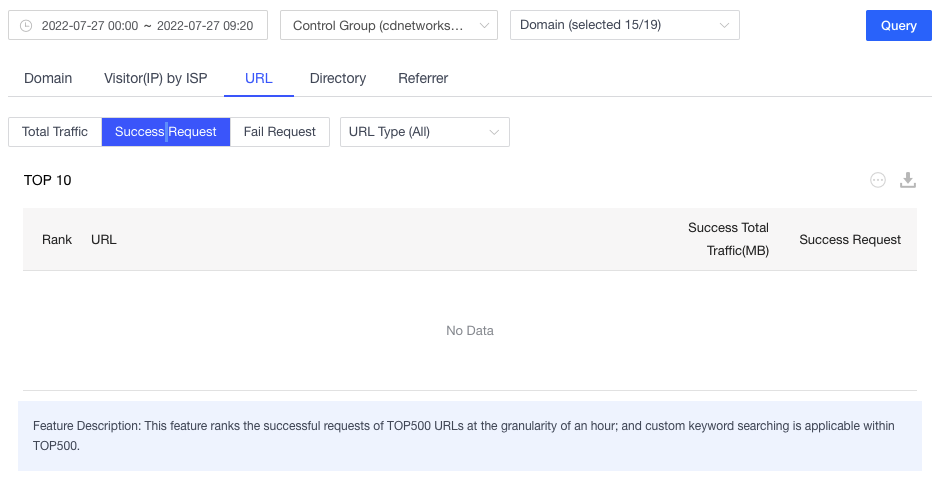
The table of Success Request shows TOP 10 URL requests and total traffic corresponding to Success Request (HTTP response codes 2xx & 3xx are counted) as default. for further details, you are able to check the total traffic and requests of top 500 URLs when you click  or
or  on the upper right of the table.

• Fail Request
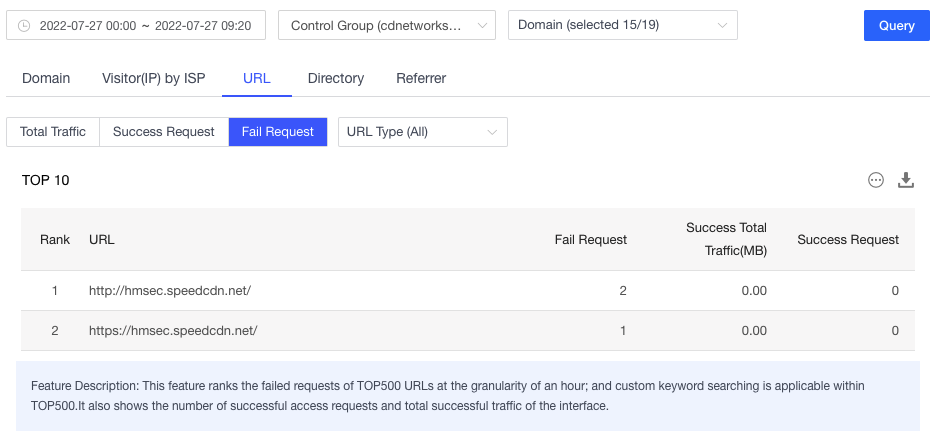
The table of Fail Request shows TOP 10 URL requests and total traffic correspond to fail request (Only HTTP response codes 0, 4xx and 5xx are counted) as default. for further details, you are able to check the total traffic and requests of top 500 URLs when you click  or
or  on the upper right of the table.
