Usage Statistics
Last update:2025-03-28 11:50:07
CDNetworks provides detailed usage statistics to help you analyze the performance and consumption patterns of your CDN services. Key dimensions include Bandwidth, Traffic, Requests, and distribution by Region/ISP.
Accessing Usage Statistics
Follow these steps to view usage statistics in the CDNetworks Console:
- Log in to the CDNetworks Console.
- Select the relevant product from the console dashboard.
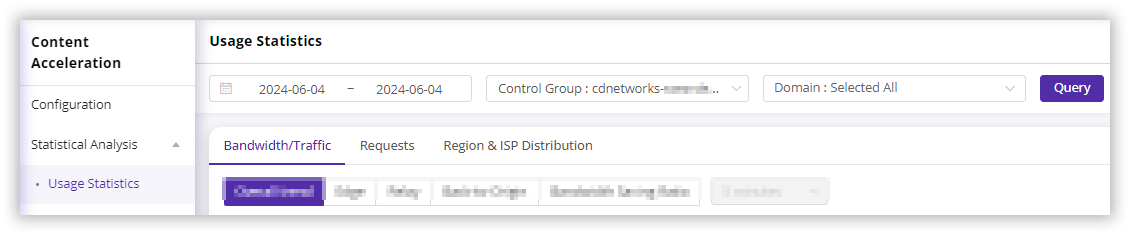
- Navigate to Statistical Analysis > Usage Statistics in the side menu.
- You will find the following main tabs:
- Bandwidth/Traffic
- Requests
- Region & ISP Distribution
- Select the tab corresponding to the data you wish to analyze.
- Specify the time range and domain(s) (or other filters like region) for your query.
- Click Query to display the statistics.
- (Optional) To export the detailed data shown in a chart, click the export icon
 located in the upper right corner of the chart area.
Understanding Usage Statistics Dimensions
Each main tab provides different views of your usage data.
Bandwidth/Traffic
This section focuses on data volume (Traffic, measured in bytes, KB, MB, GB, etc.) and data transfer rate (Bandwidth, measured in bps, Kbps, Mbps, Gbps, etc.). It contains several sub-tabs:
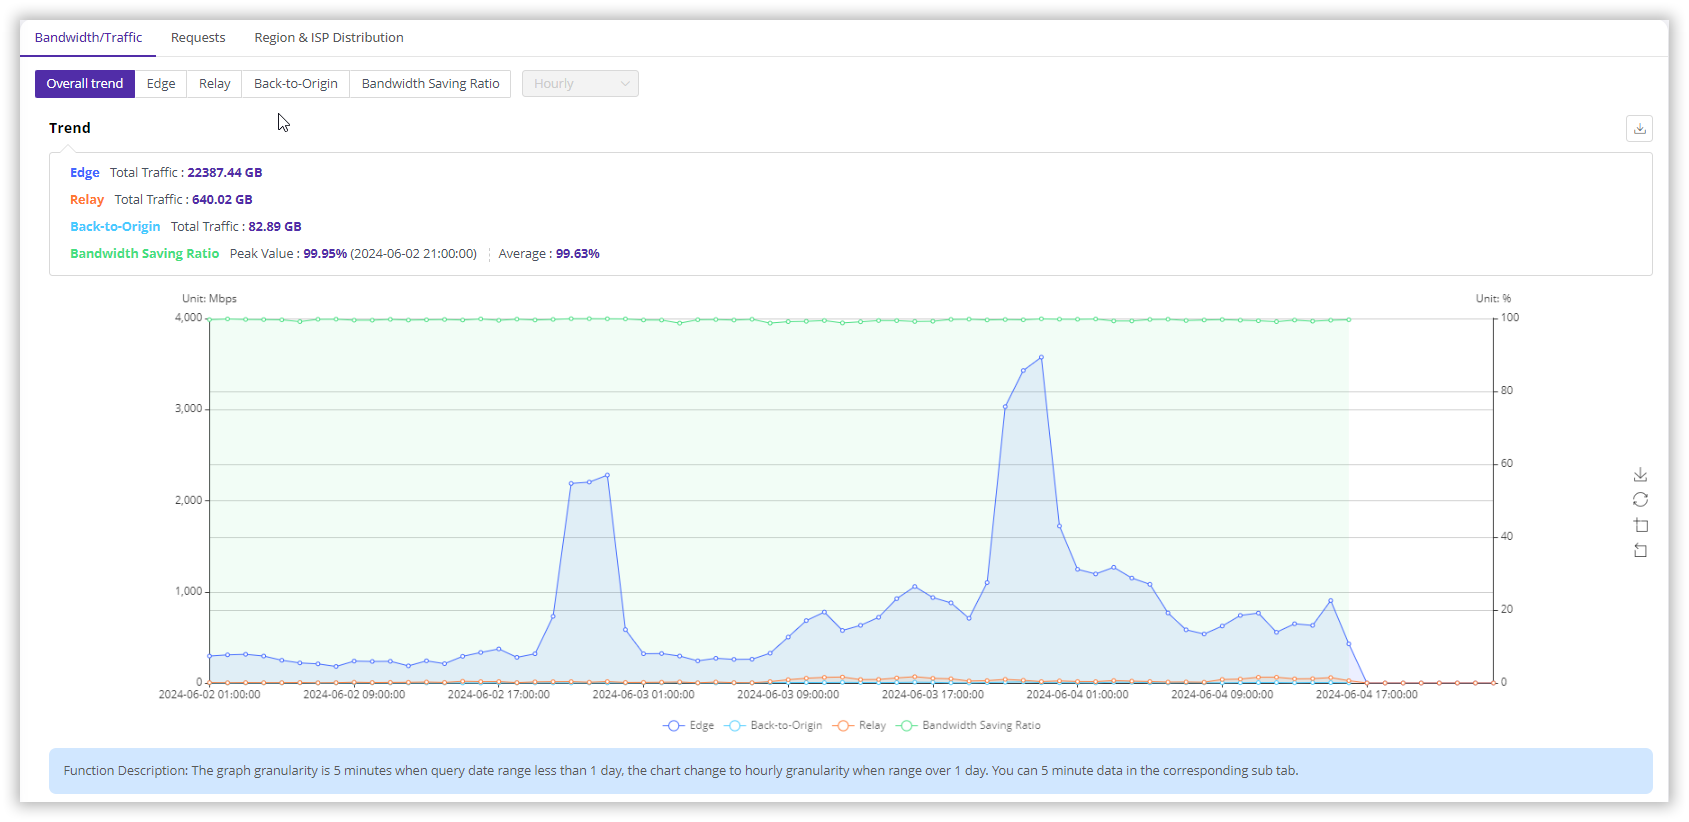
Overall Trend
- Description: A summary chart showing Bandwidth/Traffic trends for Edge Servers, Relay Servers (intermediate CDN servers), and Back-to-Origin requests, along with the calculated Bandwidth Saving Ratio.
- Granularity Note: Data granularity depends on the query time range. For ranges ≤ 1 day, granularity is 5 minutes. For ranges > 1 day, granularity is 1 hour.
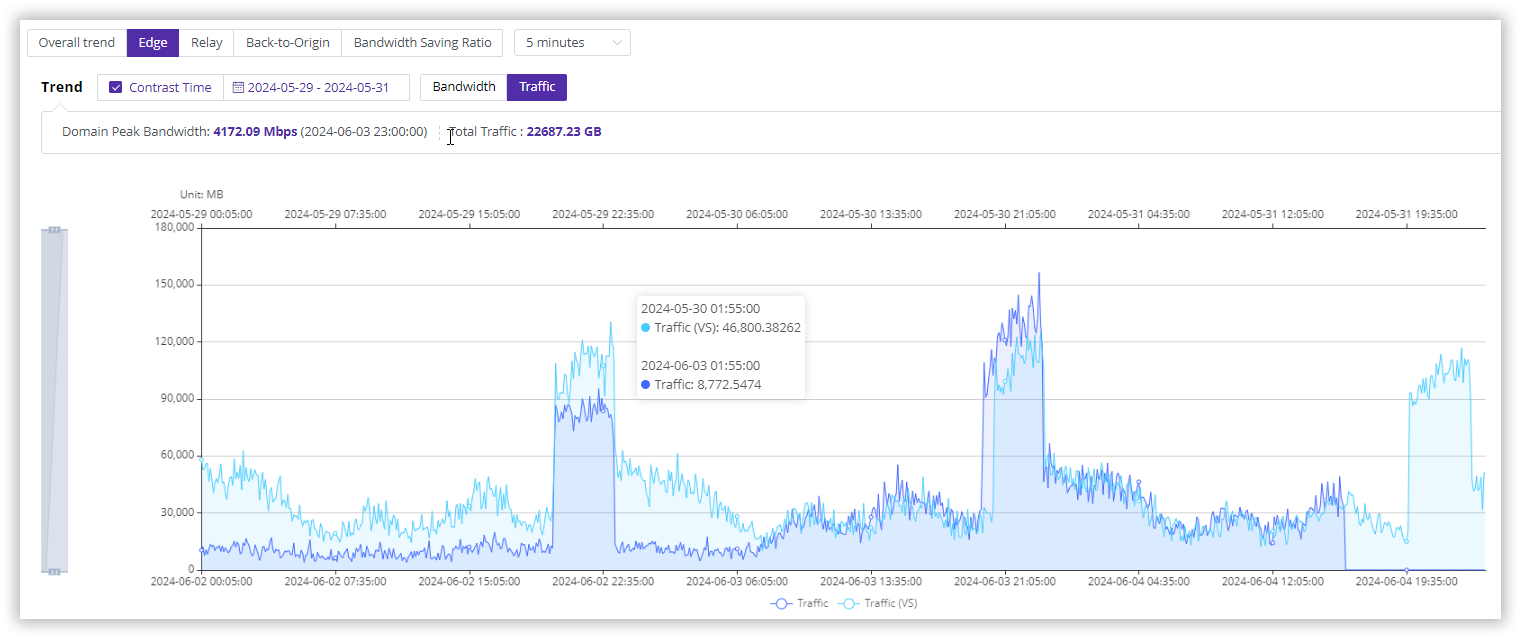
Edge
- Description: Shows the Bandwidth/Traffic generated by CDN Edge Servers delivering content to end-users.
- Granularity Note: Default granularity is 5 minutes (the minimum). You can manually switch to coarser granularities (e.g., 1 hour, 1 day) in the chart options.
- Features: Supports comparing usage across different time periods using the time comparison feature.
Relay
- Description: Shows the Bandwidth/Traffic generated on intermediate CDN Relay Servers (used in multi-tier CDN architectures).
- Granularity Note: Default and fixed granularity is 5 minutes. Manual switching to other granularities is not supported for this metric.
Back-to-Origin
- Description: Shows the Bandwidth/Traffic generated when CDN servers (typically Edge Servers) fetch content from your origin server.
- Granularity Note: Default granularity is 5 minutes (the minimum). You can manually switch to coarser granularities.
- Features: Supports comparing usage across different time periods.
Bandwidth Saving Ratio
- Description: Represents the reduction in traffic fetched from your origin server due to CDN caching. Higher ratios indicate better caching efficiency.
- Calculation:
Bandwidth Saving Ratio = (Edge Traffic - Back-to-Origin Traffic) / Edge Traffic - Granularity Note: Data granularity depends on the query time range. For ranges ≤ 1 day, granularity is 5 minutes. For ranges > 1 day, granularity is 1 hour.
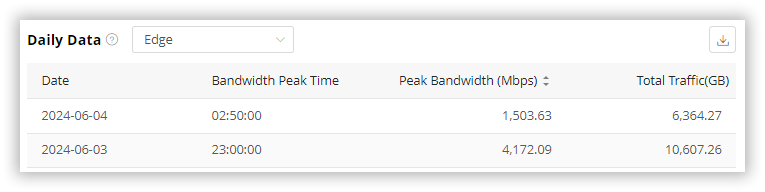
Daily Data
- Description: Provides a daily summary within the selected time range, showing Peak Bandwidth, the Time of Peak Bandwidth, and Total Traffic for each day.
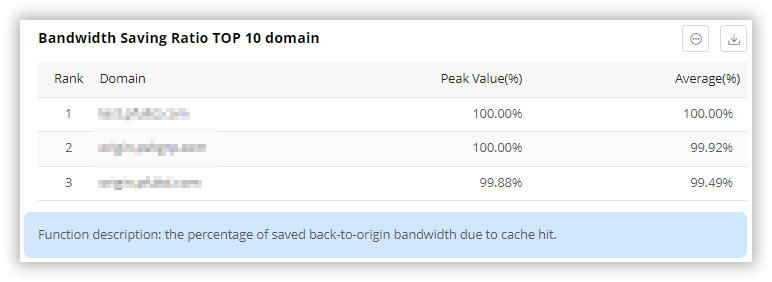
Bandwidth Saving Ratio Top 10 Domains
- Description: Lists the top 10 domains with the highest peak Bandwidth Saving Ratio within the selected time range, showing both peak and average ratios for each.
Requests
This section focuses on the number of HTTP/S requests processed by the CDN. It contains several sub-tabs:
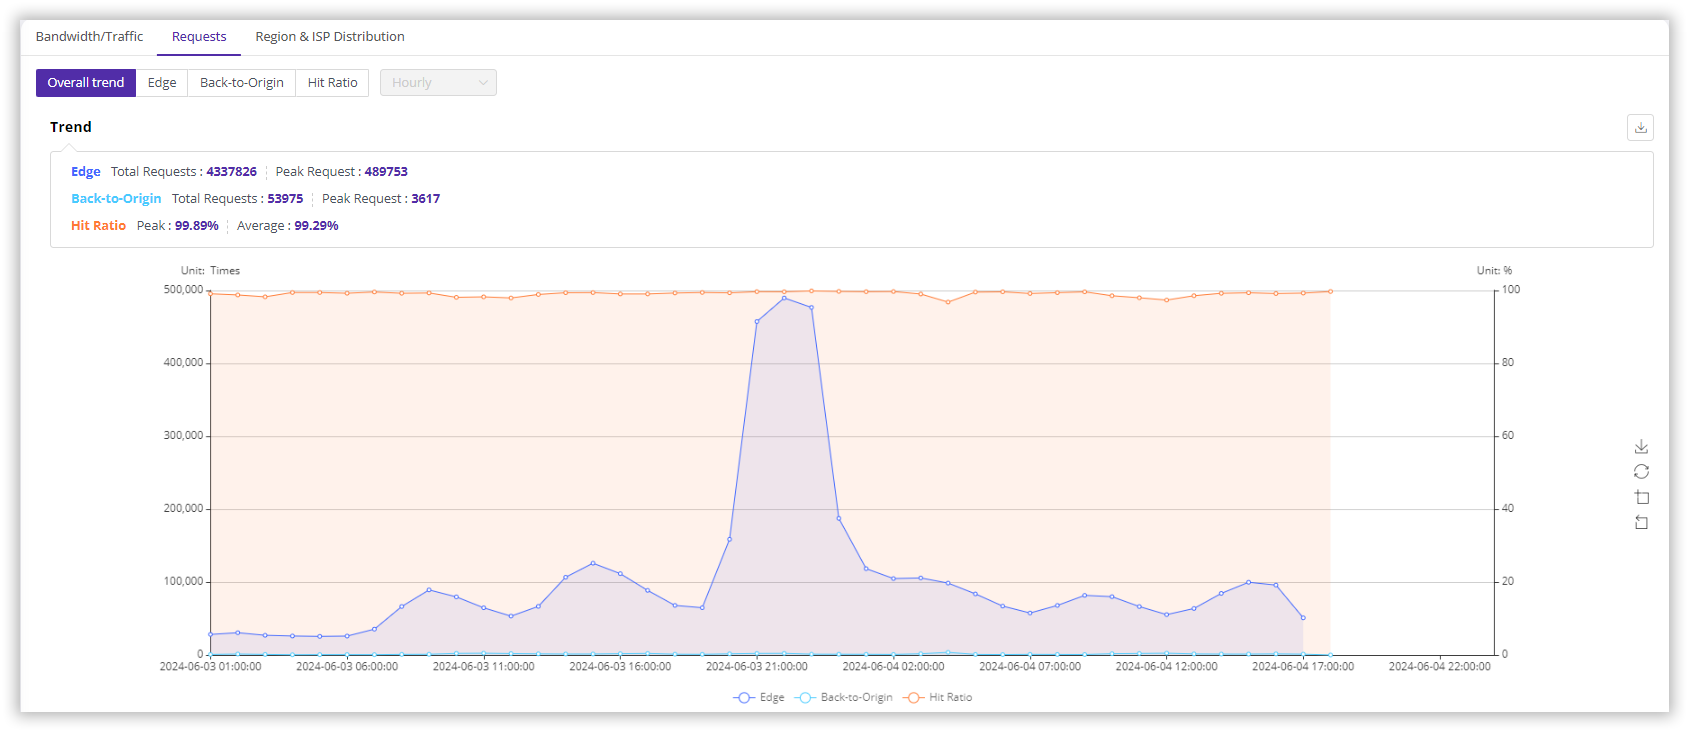
Overall Trend
- Description: A summary chart showing the number of requests handled by Edge Servers, Back-to-Origin requests, and the calculated Hit Ratio.
- Granularity Note: Data granularity depends on the query time range. For ranges ≤ 1 day, granularity is 5 minutes. For ranges > 1 day, granularity is 1 hour.
Edge
- Description: Shows the total number of requests received by CDN Edge Servers from end-users.
- Granularity Note: Default granularity is 5 minutes (the minimum). You can manually switch to coarser granularities.
- Features: Supports filtering requests by network layer protocol (
IPv4/IPv6).
Back-to-Origin
- Description: Shows the number of requests made by CDN servers to your origin server to fetch content.
- Granularity Note: Default granularity is 5 minutes (the minimum). You can manually switch to coarser granularities.
Hit Ratio
- Description: Represents the percentage of user requests served directly from the CDN cache (cache hits) without needing to contact the origin server. Higher ratios indicate better caching efficiency.
- Calculation:
Hit Ratio = (Total Edge Requests - Back-to-Origin Requests) / Total Edge Requests(Note: This assumes one Back-to-Origin request corresponds to one Edge request miss; calculation details may vary slightly based on internal logic). Alternatively, it can be viewed asCache Hit Requests / Total Edge Requests. - Granularity Note: Data granularity depends on the query time range. For ranges ≤ 1 day, granularity is 5 minutes. For ranges > 1 day, granularity is 1 hour.
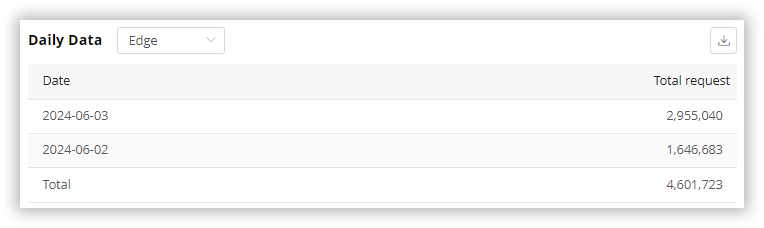
Daily Data
- Description: Provides a daily summary within the selected time range, showing the Total Number of Requests for each day.
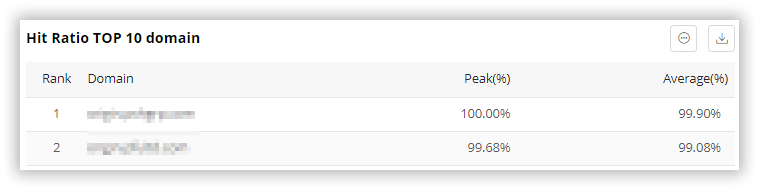
Hit Ratio Top 10 Domains
- Description: Lists the top 10 domains with the highest peak Hit Ratio within the selected time range, showing both peak and average ratios for each.
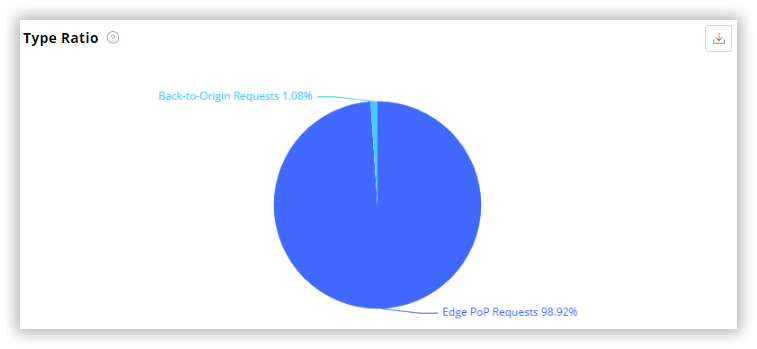
Type Ratio
- Description: Shows the proportion of Edge Requests versus Back-to-Origin Requests. A lower proportion of Back-to-Origin requests generally indicates a higher cache hit ratio.
- Edge Requests: Requests received from end-users at the CDN edge.
- Back-to-Origin Requests: Requests made from CDN servers to the origin.
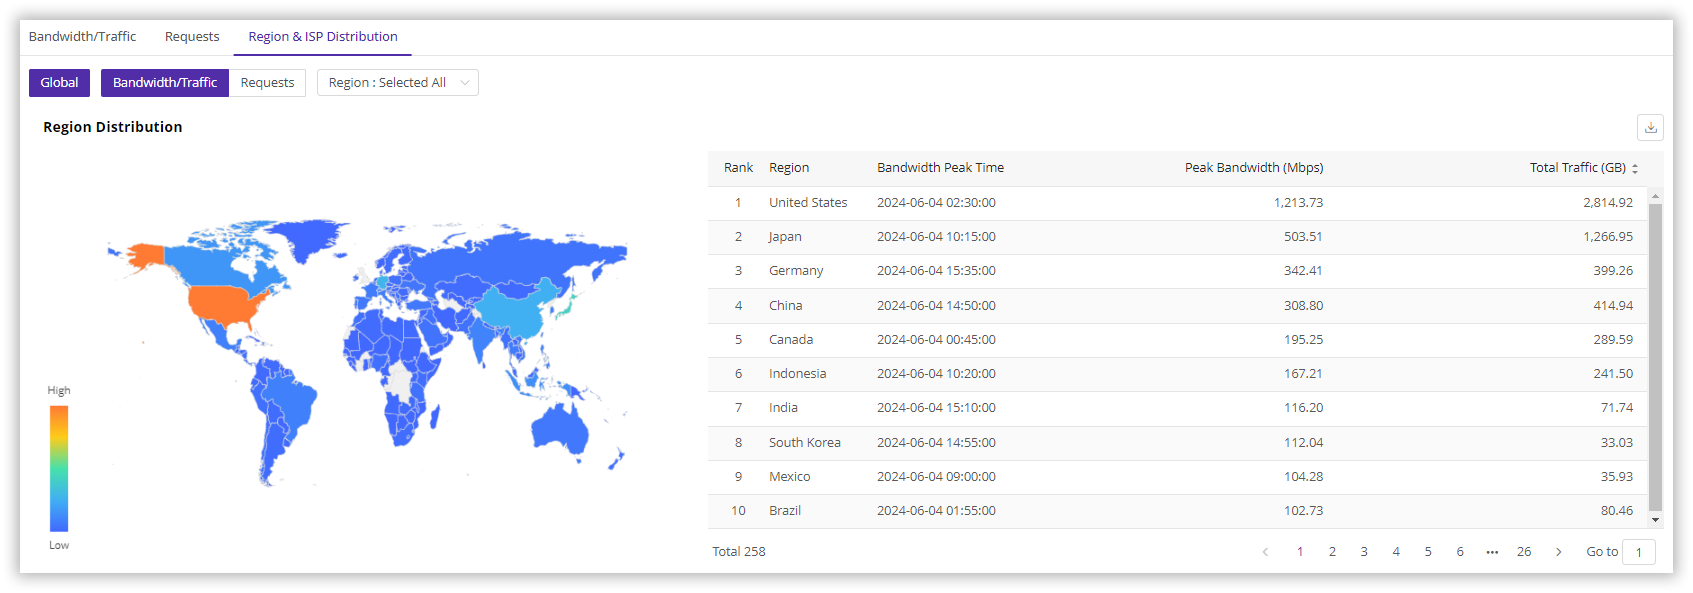
Region & ISP Distribution
- Description: Provides insights into where your users are located (based on their IP address) and breaks down usage metrics by region and sometimes Internet Service Provider (ISP).
- Views:
- Bandwidth/Traffic View: Displays Peak Bandwidth, Peak Time, and Total Traffic per region, typically sorted by Peak Bandwidth.
- Requests View: Displays the number of Requests per region and the percentage of total requests from that region, typically sorted by the number of requests.
- Filtering: You can often filter the data to view statistics for specific regions.
Is the content of this document helpful to you?
Yes
I have suggestion