Status Statistics
최신 업데이트:2025-02-21 17:27:54
CDNetworks provides detailed Status Code and Regional Distribution data to support your business analysis and issue troubleshooting.
Go to Status Statistics:
- Log in to the CDNetworks Console, find the security product in use under Subscribed Products.
- Go to Performance part, Web Analysis > Status Statistics.
1. Filter data
- You can select the Time Range, Control Group, and Domain as filters to query the data for more details.
- You will see two tabs: Status Code and Regional/ISP Distribution. Select the tab you want to view and click on it.
Each tab displays status code data from different dimensions. Refer to the detailed introduction below.
2. Status Code

Provides three reports: Edge, Real-time, and Back-to-Origin status codes:
- Edge: Edge status codes. By default, it provides status code data in hourly granularity. Other granularities, such as daily, are also available. If you need to view data in 5-minute granularity, you can click Apply for opening to open the data collection and contact CDNetworks technical support to check the progress. After opening, you can query the 5-minute detailed data of the time after the opening time. You can also click Real-time to view 5-minute granularity status code data. Please notice that the timeliness of this report is lower than that of the Real-time report. For example, if it is 9:48 AM now, you may only see status code data for 9:35 or even earlier. This data delay is more than 10 minutes.
- Real-time: Edge status codes. By default, it provides status code data in 5-minute granularity and does not support filtering by other granularities. The timeliness of this report is higher than that of Edge report. For example, if it is 9:48 AM now, you can see the status code data for 9:45 and earlier.
- Back-to-Origin: Back-to-Origin status codes, including status codes from edge servers and relay servers. By default, it provides status code data in 5-minute granularity. Other granularities, such as hourly and daily, are also available.
The data sources and collection methods for the Edge and Real-time reports are different, so the data for both may have slight differences. Both can be used for your reference. If you want to view data in 5-minute granularity, it is recommended to prioritize the status code data in Real-time report.
Trend
All status code reports provide status code data in two dimensions. You can switch between Aggregated and Detailed as needed.
- Aggregated: Aggregate different status codes according to below set rules for display.
- Detailed: Display status codes directly without aggregation.
| Status Code Type | Status Code |
|---|---|
| Success | 200,210,206 |
| Redirect | 302,301,303,305,307 |
| Not-Modified | 304 |
| Permission | 400,401,403,405,406,407,408,409,410,411,412,413,414,415,416,417,421,422,423,424 |
| Not-Found | 404 |
| Server Error | 500,501,502,503,504 |
| Others | 0,-1 |
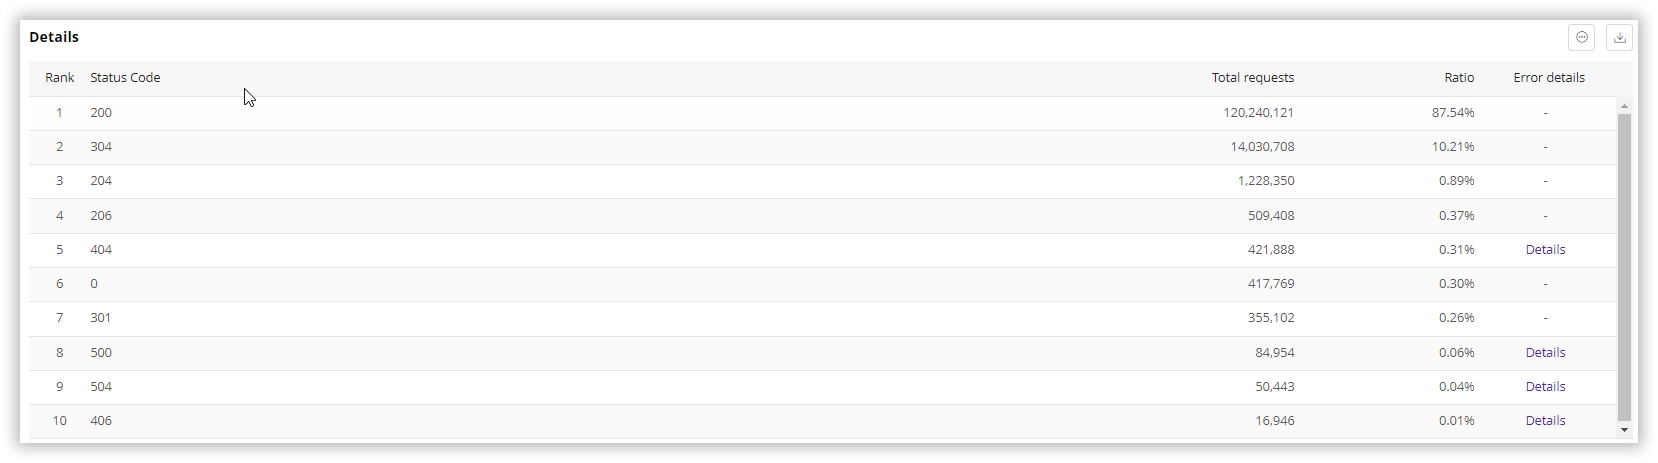
Details
You can check the requests and its proportion corresponding to each specific status code here.
What’s more, the edge report will additionally display error details. Click the Details button corresponding to the status code to view the TOP URLs for that status code and their referrers and requests. You can export more TOP URLs if needed.
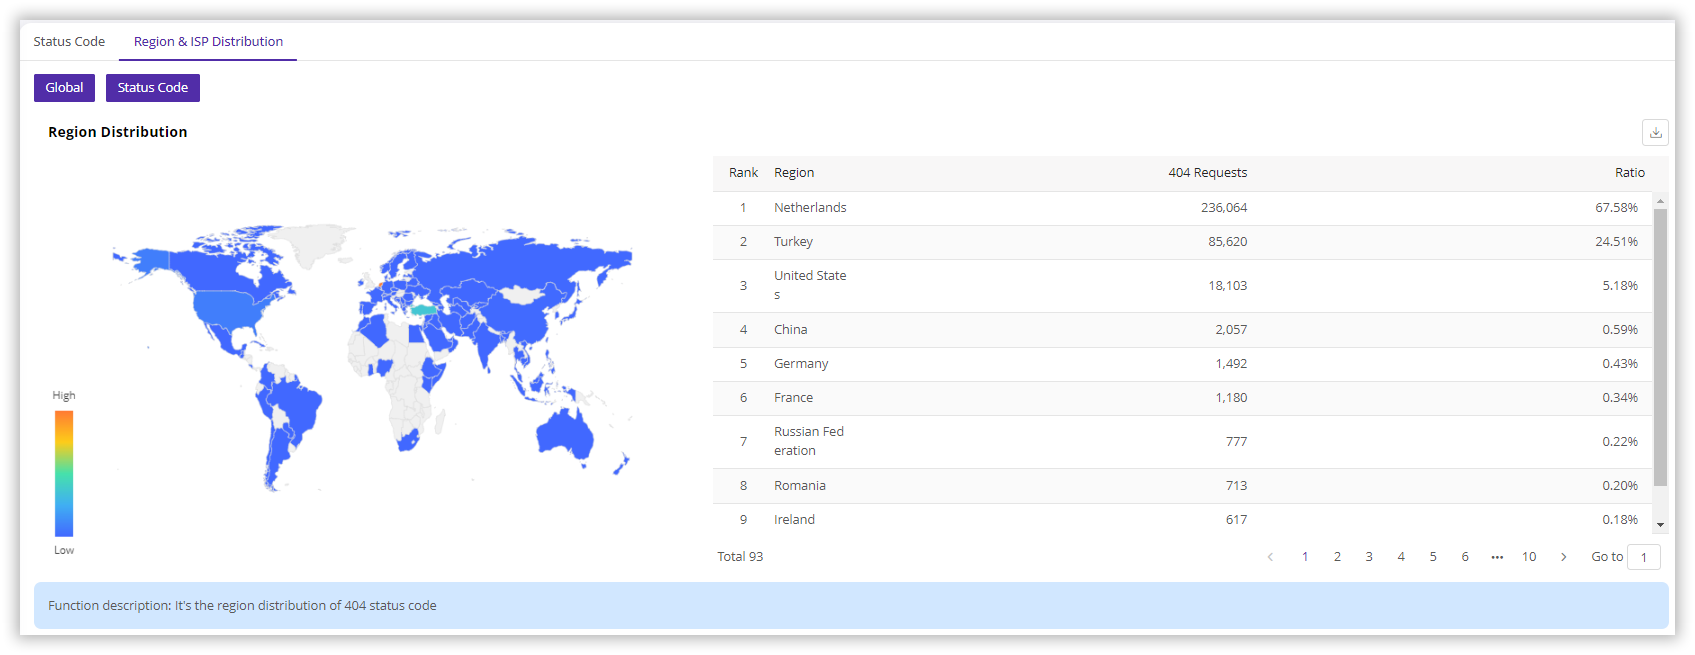
3. Region & ISP Distribution
Displays the regional distribution of 404 status codes, including the number of requests for 404 status codes and their corresponding proportions.