Create Custom Alert Rules
最終更新日:2026-03-13 17:42:52
You can configure custom alert rules based on your own business requirements, and this article will guide you through creating a new custom alert rule.
Go to the Add Alert Rule page:
1. Log in to the CDNetworks Console. Within the subscribed products, choose the security product you are using and click to enter.
2. Navigate to Analysis & Logs > Alert Management > Alert Rules > Add Alert Rule.
Operation Steps
Step 1: Configure Basic Information
- Configure Rule Name and Description.
Step 2: Configure Alert Rules
-
Configure Alert Level: Set the alert level for triggered events. This is used to determine the priority for alert handling. Available levels: Emergency, Critical, Warning.
-
Select Monitoring Object:
- L7 Protection: Monitoring Hostname.
- L4 Protection: Monitoring Resource Group.
Note: The monitoring hostnames that can be selected in L7 Protection are the hostnames that have been accessed to security protection.
-
Configure Statistical Method:
- Separate: Monitor the data of each one in the monitoring objects.
- Aggregate: Monitor the aggregate data in the monitoring objects. A maximum of 1000 objects are supported, and the first 1000 for aggregated statistics would be included if the upper limit is exceeded.
-
Configure Statistical Metrics:
Statistical Period
| Description | Configuration Item | Configurable Options |
|---|---|---|
| A statistical period consists of statistical granularity and the number of continuous statistical points. Statistical Granularity: Define the detection interval. The number of continuous statistical points: Define the detection duration. For example, if you select a 1-minute granularity with 3 consecutive statistical points, the system will conduct the metric detection every minute. If the configured threshold is met for all 3 consecutive times, an alert will be triggered. |
N-Minute Statistical Granularity | 1-minute, 2-minute, 5-minute, 10-minute statistical granularity |
| Continuous for N Statistical Points | Continuous for 1, 2, 3, 4, or 5 statistical points |
Statistical Metrics
| Description | Monitoring Object | Configuration Item | Configurable Options | Example of Metric Calculation Logic |
|---|---|---|---|---|
| Statistical metric sets the monitoring formula to be calculated. A statistical metric includes: basic metrics and filters, which are combined to filter out metrics that meet the filter conditions among the statistics. | L7 Protection | Basic Metrics | Requests QPS Back-to-Origin Requests Back-to-Origin QPS |
Configuration: Basic Metrics: Number of Requests Filter Fields: 1. WAF - Rule Type = XSS, SQL; 2. Action = Deny That is: The number of requests where Action is Deny and WAF - Rule Type is triggered as XSS or SQL Please select filter fields for enabled protection services to ensure the system can monitor relevant data and send alerts. |
| Filters | Policy: Policy Type, Action Request: Path, Request Method, Status Code DDoS Protection: Policy Name WAF: Rule Type |
|||
| L4 Protection | Basic Metrics | Peak Attack Bandwidth Basic Metric: DDoS Attack Bandwidth Peak Value Filter Field: DDoS Attack Type = SYN, ACK That is: The sum of the peak bandwidth of SYN Flood and ACK Flood attacks The logic of CPS blackhole alert is: if any CPS IP in the resource group is blackholed, the alert will be triggered; when the blackhole is released, the alert will be resolved. | ||
| Filters | CPS Blackhole |
Threshold Operator
| Operator Type | Operator | Example |
|---|---|---|
| Value Comparison | > , >= | Number of requests > 100 |
| <, <= | Number of requests < 100 | |
| =, != | Number of requests = 100 | |
| Cross-period Fluctuation | Up vs yesterday, Down vs yesterday | E.g., Back-to-Origin Requests 30% up vs yesterday Comparison Calculation & Processing Mechanism Note: Currently, comparison calculations do not support adding filter conditions. |
| Ratio Calculation | Proportion >=, Proportion < | E.g., Back-to-origin 5xx error request Proportion >= 20% Basic Metric: Back-to-Origin Requests Proportion >= 20%Filters: Status Code equals 5xx Note: To calculate the proportion, a filter condition must be added in order to compute the valid percentage. |
- Configure Alert Frequency:
| Configuration Item | Optional Settings | Example |
|---|---|---|
| Alert every N minutes | First time only, Every 5 minutes, 10 minutes, 15 minutes, 30 minutes, every 1/2/6/12/24 hours | Scenario: If an alert lasts for 12 minutes and the configuration is set to send an alert every 5 minutes with alert resolution notification required. The first notification will be sent when triggered, the second notification after 5 minutes, the third notification after 10 minutes, and a recovery notification will be pushed when alert resolution is triggered at the 12th minute. |
| Is alert resolution notification required? | Yes/No |
Step 3: Configure Alert Notifications
- Set Notification Period: Configure the time period during which alert notifications are received. Alerts outside of this period are only recorded in alert history but no notifications are sent.
- Set Time Range: Start Time and End Time
- Confirm Time Zone
- Select Active Days: Monday to Sunday
Note: Setting the start time later than the end time supports cross-day periods. For example, if you configure
23:00-02:00, the notification period will be from 23:00 on the current day to 02:00 on the following day.
-
Select Notification Language: Simplified Chinese or English.
-
Configure Notification Method:
- Email: Add contacts or contact groups under Account Management > Contact Management. For details, see Contact Management.
- Bot: Add a bot under Message Center > Bot Management. Supported platforms include WeCom, DingTalk, Telegram, Feishu, Lark, Slack.
By default, each customer can customize up to 20 alert rules.
Sample Scenarios
Scenario 1: Detect the Rule Deployment of Adaptive Protection to Block Traffic from CC Attacks
Scenario Description
When a new type of CC attack occurs, the Adaptive Protection will detect the threats based on the attack features that have already been learned and then generate corresponding protection rules. In this case, through the alert, clients can quickly perceive the release of rules and the actions for traffic handling, and then assess whether there is a risk such as false blocking.
Configuration Overview
- On the Alert Management page, click Add Alert Rule to enter the alert rule configuration page.
- Configure Basic information: Rule Name and Description (optional).
- Configuration details:
- Select the Alert Level.
- Select the Monitoring Object: L7 protection - All hostnames.
- Select the Statistical Method: Separate
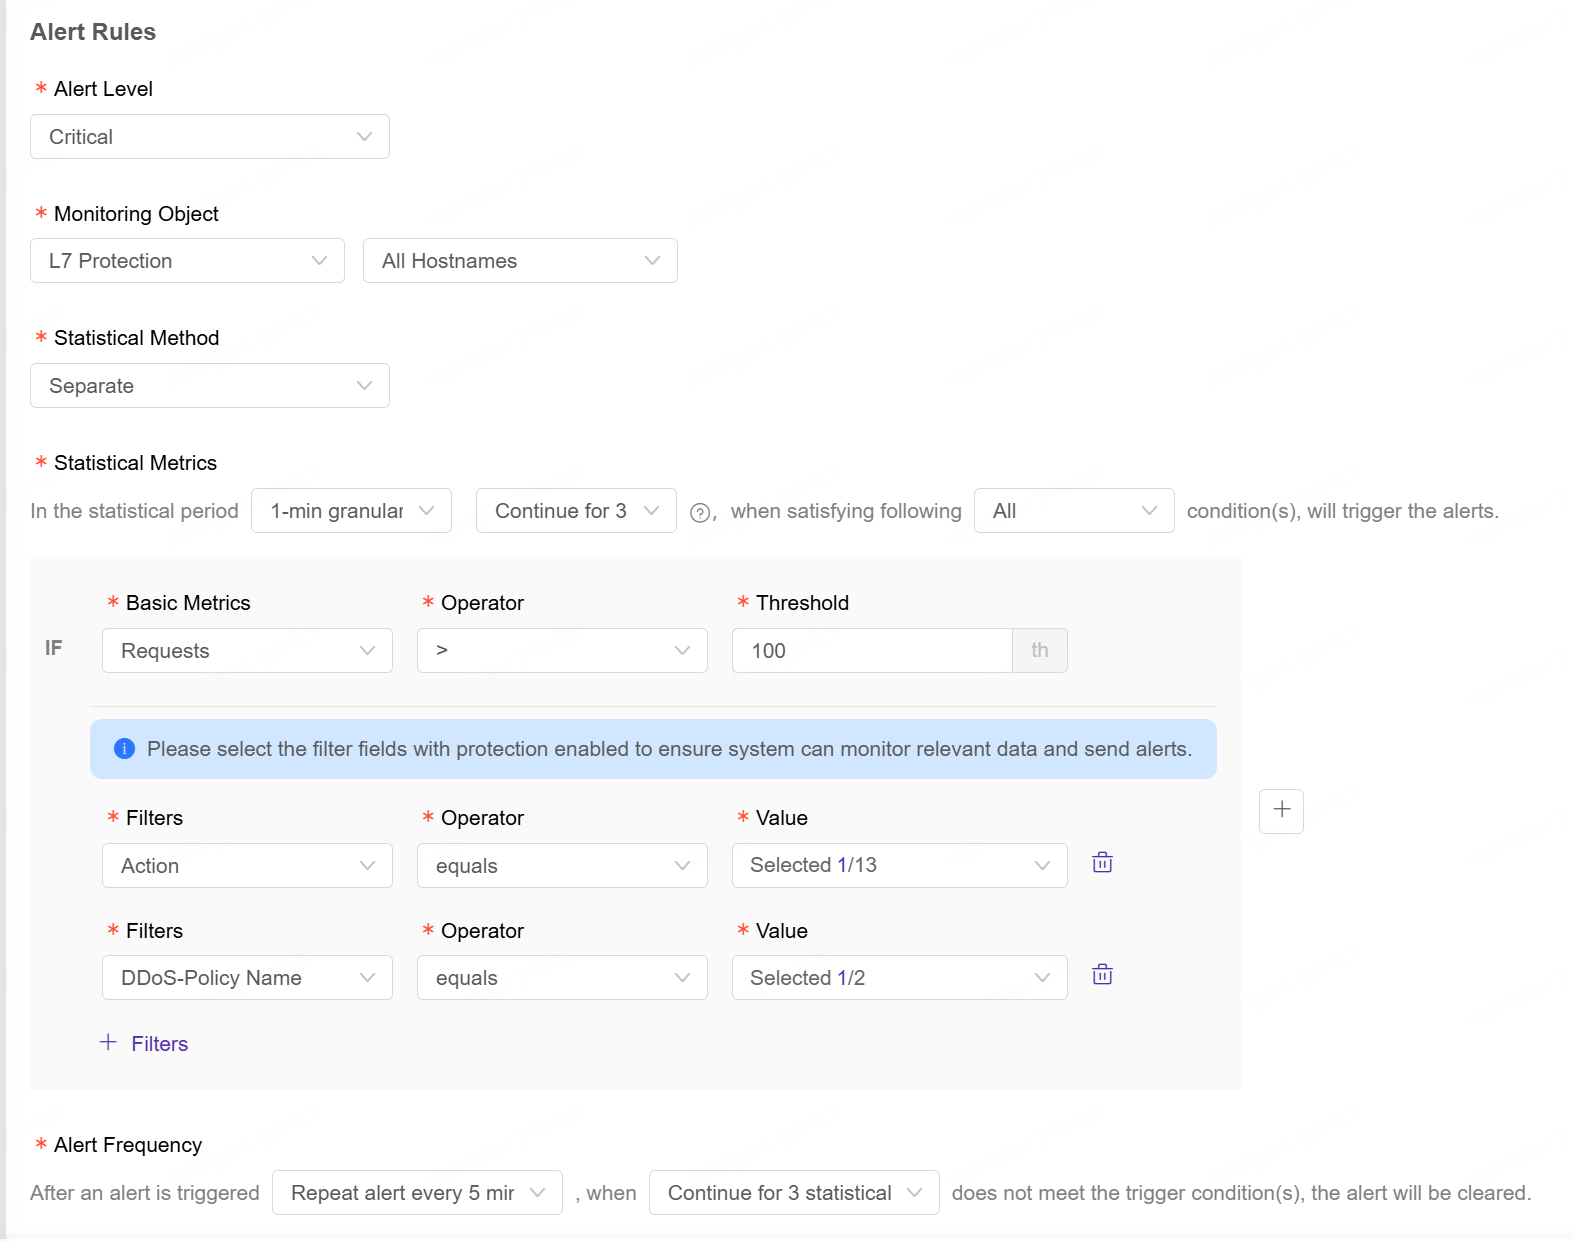
- Configure Statistical Metrics: For example, 1 minute granularity, continuous for 3 statistical points;trigger an alert only when all conditions are met. Configure the basic metric formula such as Requests > 100 and the filters such as Action equals Block, and DDoS Protection – Policy Name = Adaptive Protection.
- Configure the alert frequency: For example, Repeat alert every 5 minutes. The Adaptive Protection rules will be automatically deleted 15 minutes after the attack stops, and you can configure: when the trigger conditions are not met for 5 consecutive statistical period, the alert will be resolved.
- Configure Alert Notification: Select Yes for Alert Resolution, configure the Notification Period to the default (all time duration), Notification Language, and Notification Method.