Usage Statistics
최신 업데이트:2025-02-21 17:02:24
CDNetworks provides various dimensions of Usage Statistics data to meet your different needs. The dimensions include Traffic, Bandwidth, Requests, and usage by region.
Go to Usage Statistics:
- Log in to the CDNetworks Console, find the security product in use under Subscribed Products.
- Go to Performance part, Web Analysis > Usage Statistics.
1. Filter data
- You can select the Time Range, Control Group, and Domain as filters to query the data for more details.
- You will see three tabs: Bandwidth/Traffic, Requests, and Region & ISP Distribution. Select the tab you want to view and click on it.
Each tab displays status code data from different dimensions. Refer to the detailed introduction below.
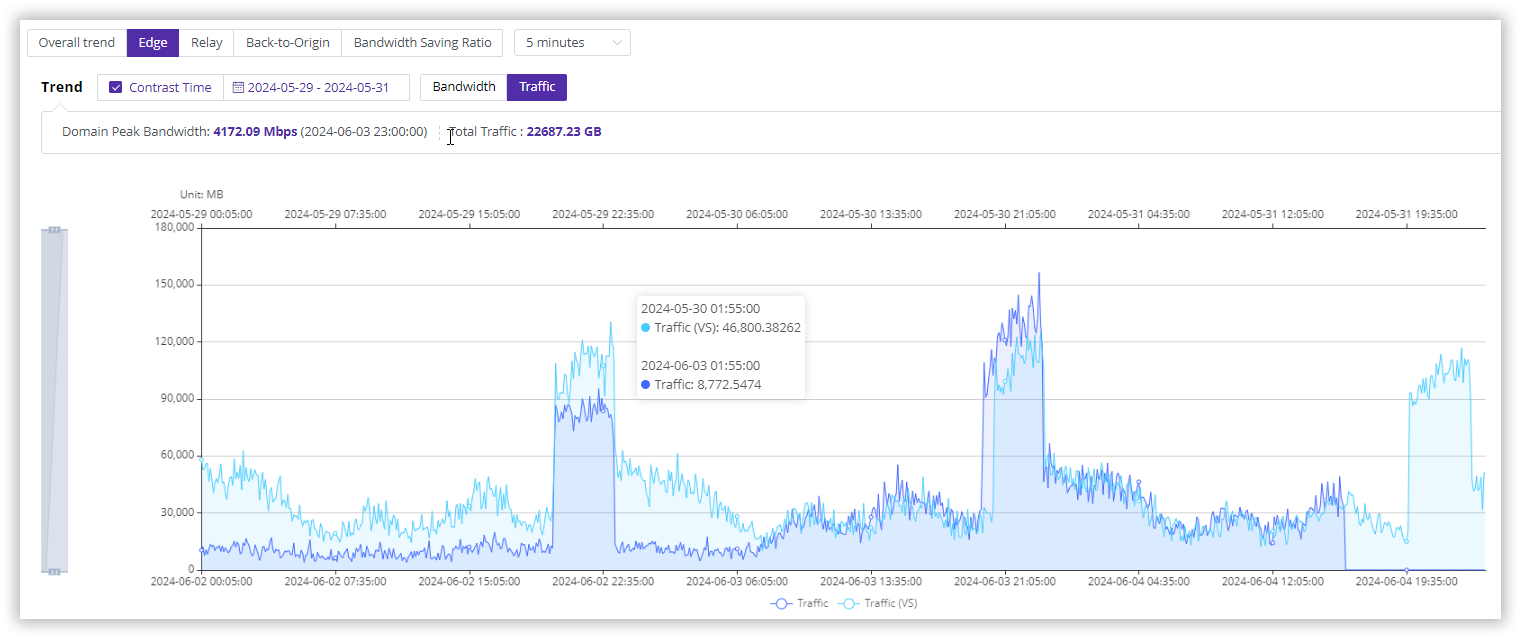
2. Bandwidth/Traffic
Edge
This chart shows the bandwidth/traffic generated on the CDN edge servers.
- The default data granularity is 5 minutes, which is also the smallest granularity. You can switch to other granularities manually.
- Supports viewing comparative traffic/bandwidth usage across different time periods.
Relay
This chart shows the bandwidth/traffic generated on the CDN relay servers.
The default data granularity is 5 minutes, cannot be switched to other granularities manually.
Back-to-Origin
This chart shows the bandwidth/traffic generated during the back-to-origin process on the CDN servers.
- The default data granularity is 5 minutes, which is also the smallest granularity. You can switch to other granularities manually.
- Supports viewing comparative traffic/bandwidth usage across different time periods.
Bandwidth Saving Ratio
The bandwidth saving ratio allows you to see the value brought by caching.
- Bandwidth Savings: Without CDN, each end-user request would be sent to the origin server, generating bandwidth on the origin server. With CDN, the CDN can directly respond to cached files without going back to the origin, saving bandwidth on the customer’s origin server.
- Bandwidth Saving Ratio: The reduced back-to-origin bandwidth due to CDN responding with cached files. Calculation formula = (Total Traffic - Back-to-Origin Traffic) / Total Traffic, where Total Traffic = Edge Traffic.
When the query time range is less than or equal to one day, the data granularity is 5 minutes; when the query time range exceeds one day, the data granularity changes to 1 hour.
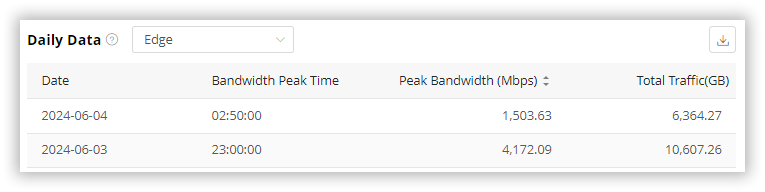
Daily Data
Displays the peak bandwidth, peak time, and traffic for each day within the query time range.
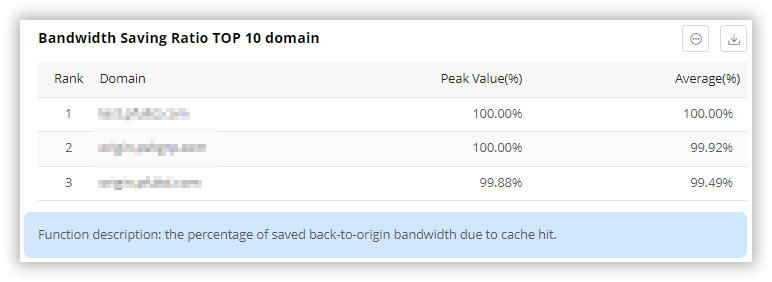
Bandwidth Saving Ratio Top 10 Domain
Filters the top 10 domains by the peak bandwidth saving ratio within the query time range and displays the peak and average bandwidth saving ratios for these domains.
3. Requests
Edge
This chart shows the number of requests generated on the CDN edge servers.
- The default data granularity is 5 minutes, which is also the smallest granularity. You can switch to other granularities manually.
- Supports selecting request data for different network layer protocols, such as IPV4 and IPV6.
Back-to-Origin
This chart shows the number of requests generated during the back-to-origin process on the CDN servers.
The default data granularity is 5 minutes, which is also the smallest granularity. You can switch to other granularities manually.
Hit Ratio
Without CDN, each end-user request would be sent to the origin server. With CDN, the CDN can directly respond to cached files without going back to the origin. This process is called hit. The hit ratio = Requests hit by CDN / Total Edge Requests.
When the query time range is less than or equal to one day, the data granularity is 5 minutes; when the query time range exceeds one day, the data granularity changes to 1 hour.
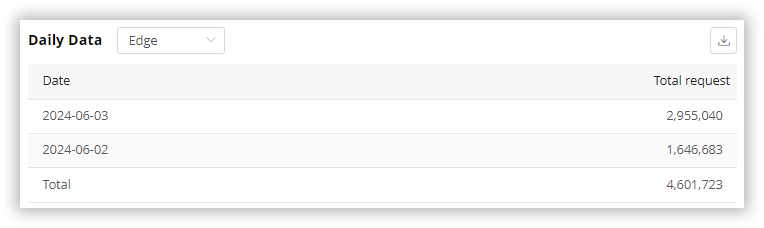
Daily Data
Displays the total number of requests for each day within the query time range.
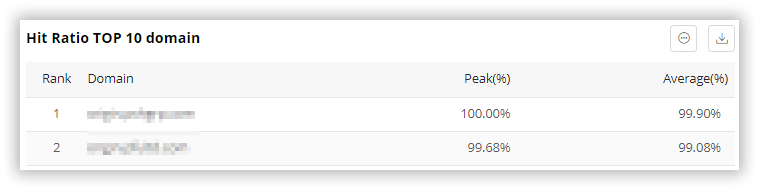
Hit Ratio Top 10 Domain
Filters the top 10 domains by the peak hit ratio within the query time range and displays the peak and average hit ratios for these domains.
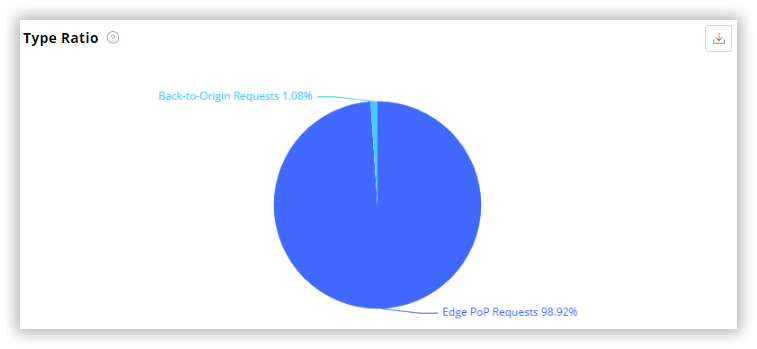
Type Ratio
- Edge PoP Requests: The number of requests received by the CDN edge servers from end-users.
- Back-to-Origin Requests: The number of requests generated when CDN servers request content from the origin.
The ratio of these two types can determine the CDN cache hit ratio. The lower the Back-to-Origin request ratio, the higher the hit ratio.
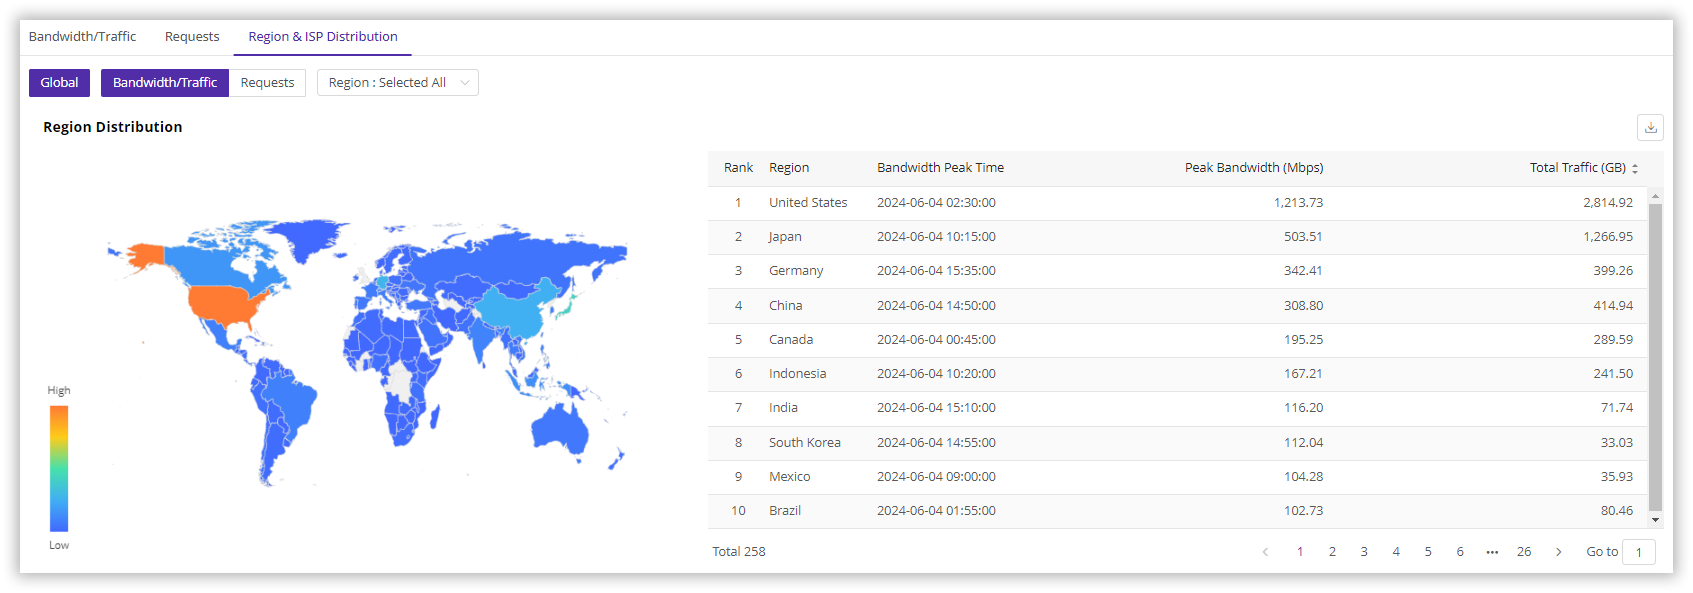
4. Region & ISP Distribution
- Bandwidth/Traffic: Display the peak bandwidth, peak time, and total traffic by region, sorted in descending order of peak bandwidth.
- Requests: Display the number of requests by region and the proportion of total regional requests, sorted in descending order of requests.
- Region: The region refers to the area where the end-user is located. You can filter the region you want to view.