Visitors Statistics
최신 업데이트:2025-02-21 18:17:18
CDNetworks provides various dimensions of Visitors Statistics of Non-Website services to meet your different needs. The dimensions include IP and Regional Distribution.
Go to Visitor Statistics:
- Log in to the CDNetworks Console, find the security product in use under Subscribed Products.
- Go to Performance part, Non-Web Analysis > Visitor Statistics.
1. Filter data
- You can select the Time Range, Control Group, and Domain as filters to query the data for more details.
- You will see two tabs: IP and Regional Distribution. Select the tab you want to view and click on it.
Each tab displays status code data from different dimensions. Refer to the detailed introduction below.
2. IP
Visitors’ IP amount of the selected domain within the query time range. You can view: detailed charts, total IP amounts, and peak IP amounts.
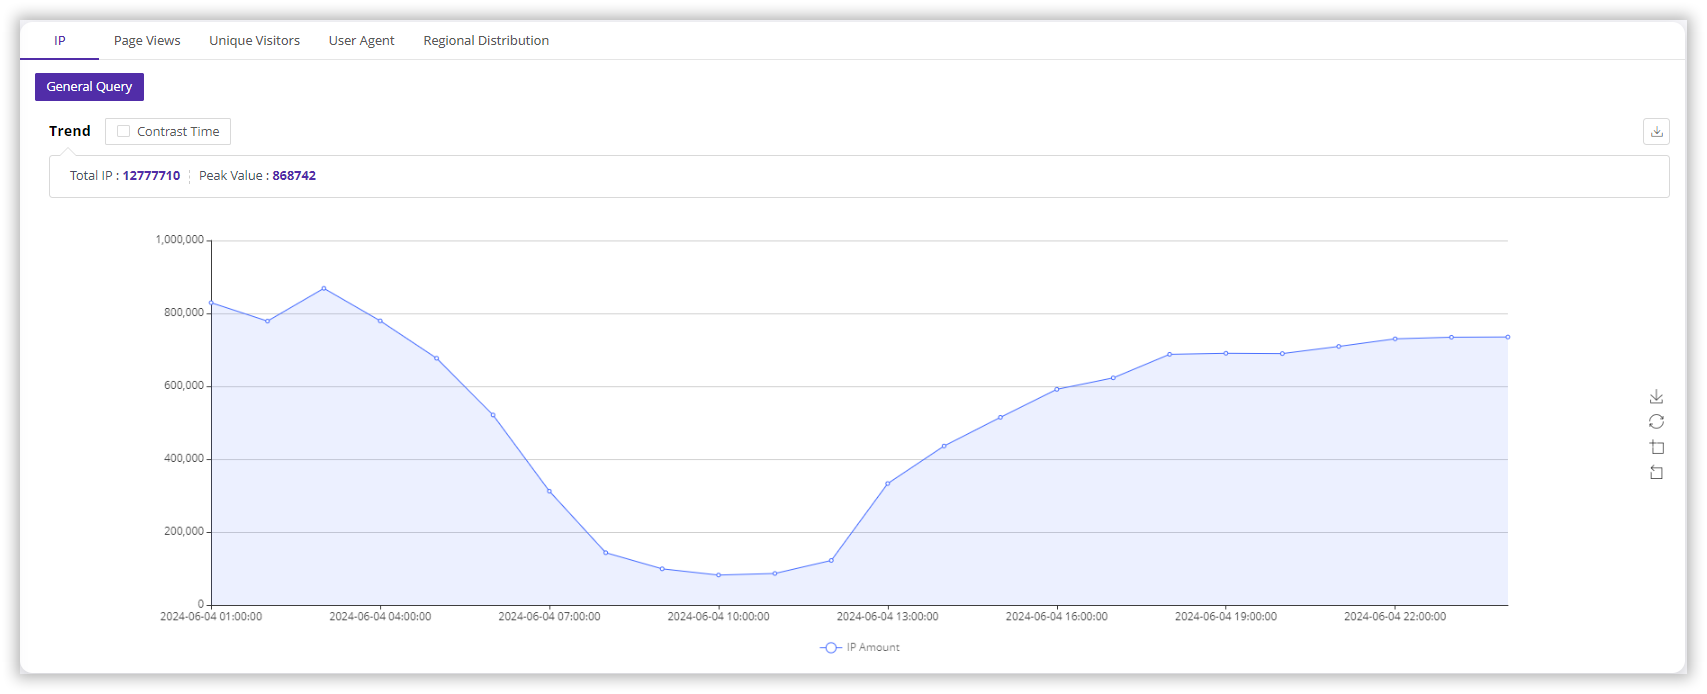
- When the query time is less than one day, the chart data granularity is one hour: an IP visiting multiple times within one hour will only be counted once, 00:00:00-01:00:00 data is calculated at the 01:00:00 time point.
- When the query time is greater than one day, the chart data granularity is one day: an IP visiting multiple times within one day will only be counted once.
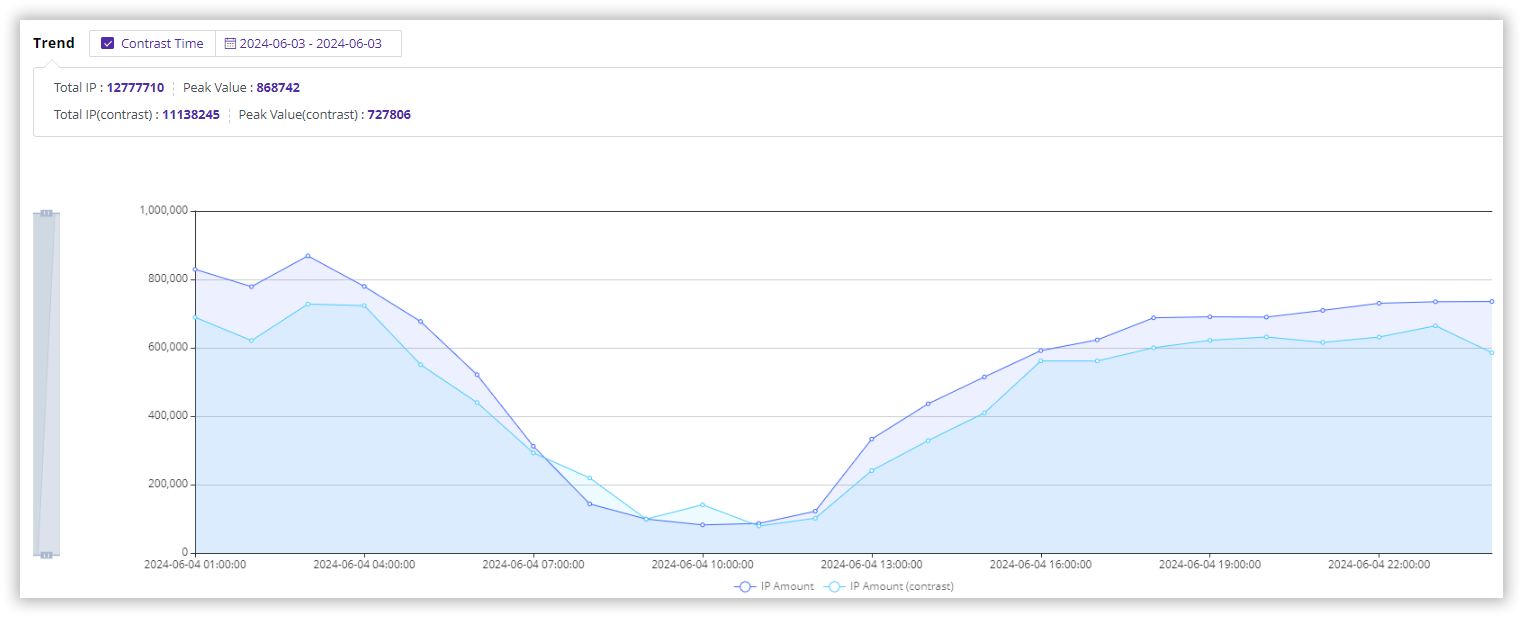
- Click Contrast Time, select the time periods, and click Query to display a comparison of visitor IP amounts between the two time periods.
3. Regional Distribution
Regional distribution data of the selected domain within the query time range. The region is based on the visitor’s IP.
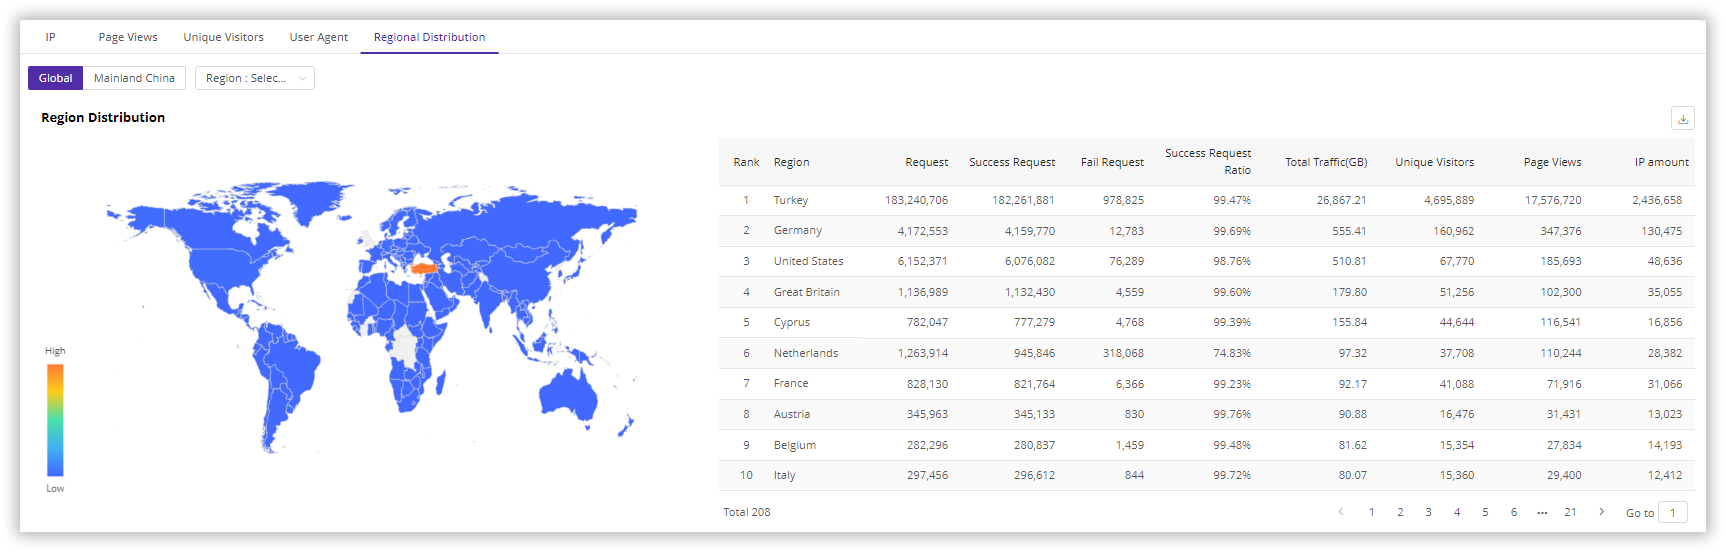
- Success Request: Requests with status codes in the [100,399] range are counted as success requests.
- Fail Request: Requests with status codes outside the [100,399] range are counted as fail requests.
- Success Request Ratio = Success Requests / Total Requests
이 문서의 내용이 도움이 되었습니까?
예
아니오