Status Code
更新时间:2023-02-10 17:12:08
• Entrance
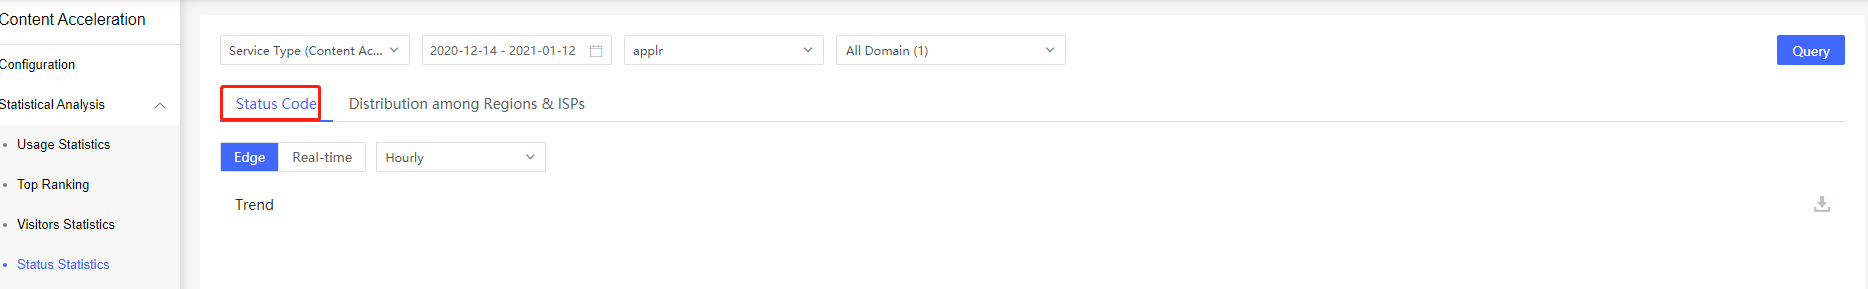
Product → Statistical Analysis → Status Statistics → Status Code
• Introduction
Status code, which differentiates requests by dissimilar status code types and presents the proportion correspondingly, is separated into 2 parts as trend and detailed data. Data generated within 2 years is traceable, while only query date that span 1-31days is acceptable for every single query. Total request number here is the accumulative number of requests received in query time. Data export is available.
Status code type counted here are listed as follows:
| NO. | Status Code Type | Status Code |
|---|---|---|
| 1 | OK | 200,210,206 |
| 2 | Redirect | 302,301,303,305,307 |
| 3 | Not-Modified | 304 |
| 4 | Permission | 400,401,403,405,406,407,408,409,410,411,412,413,414,415,416,417,421,422,423,424 |
| 5 | Not-Found | 404 |
| 6 | Server Error | 500,501,502,503,504 |
| 7 | Other | 0,-1 |
1 Edge (Edge Status Code)
• Trend
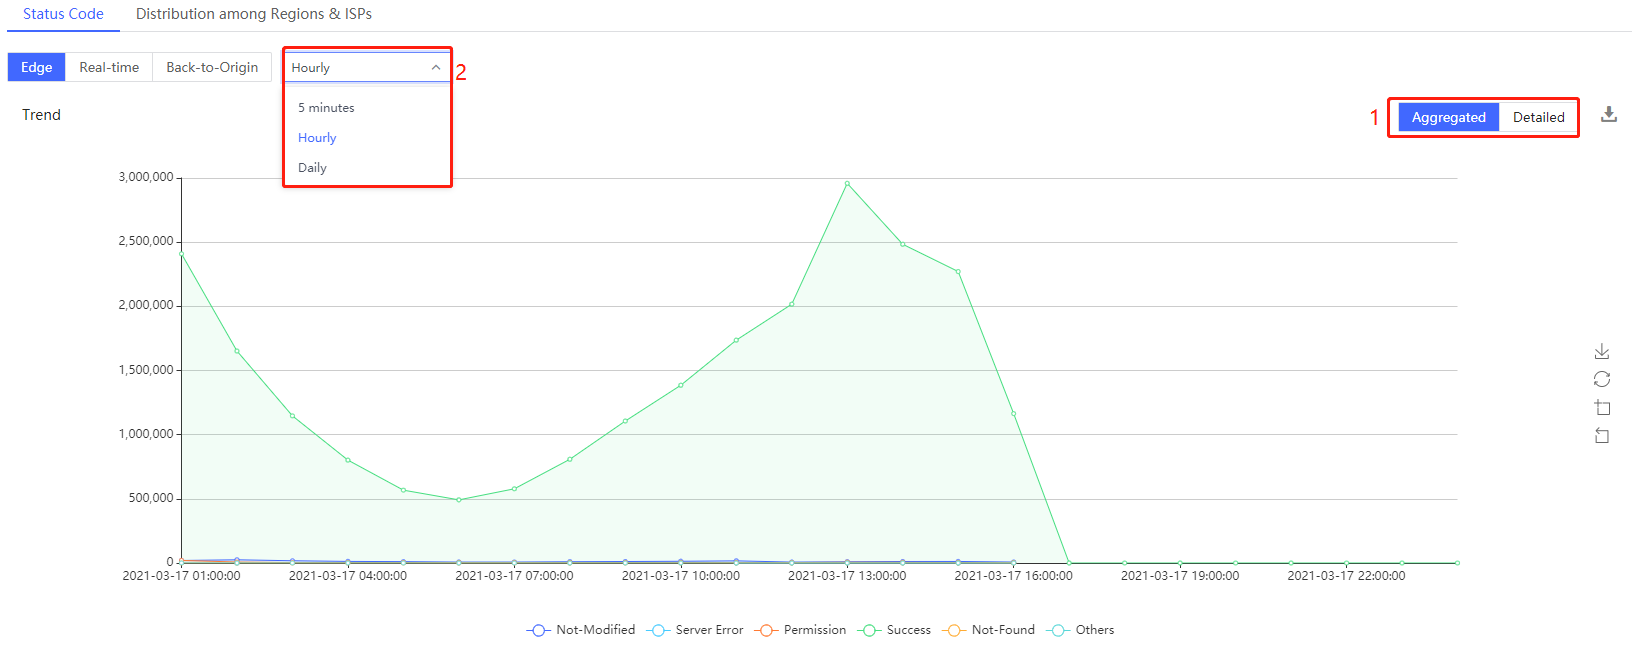
There are two kinds of trend chart, one is aggregation chart, which generates status trend chart by classifying status codes, and the other is detailed status code trend chart. You can switch aggregation chart and detailed chart through the tab(1).there is also a private query criterion for you to switch the data granularity including 1-hour and 5-minute level(2).
Function Description: The trend chart displays only TOP10 status codes, more status code trend details to export data view
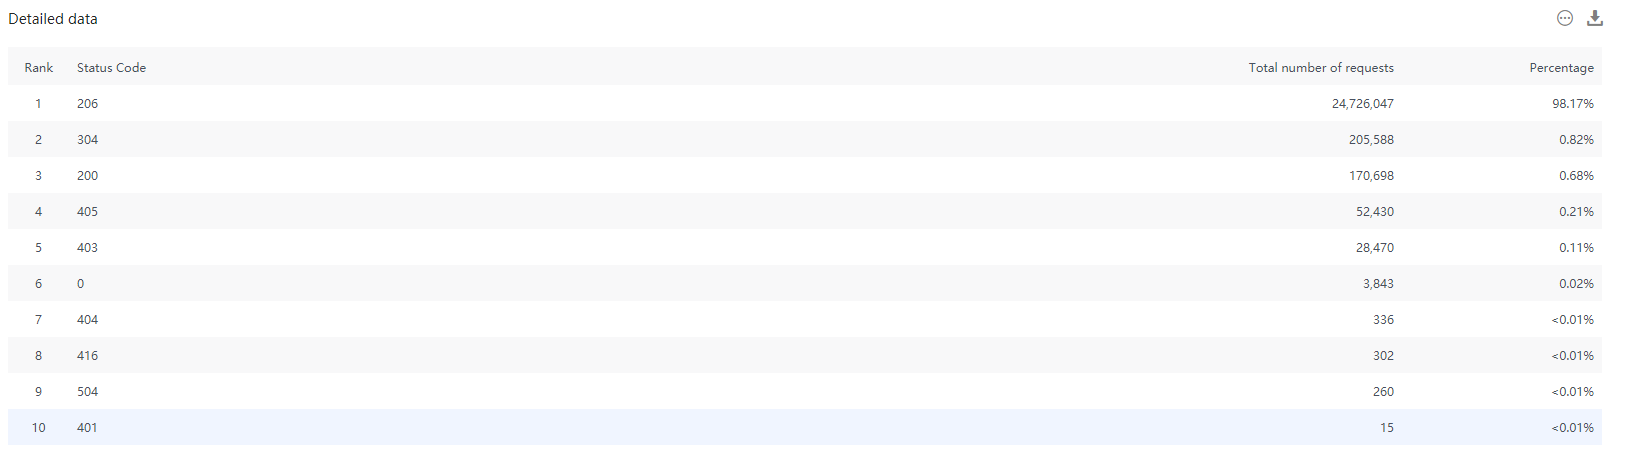
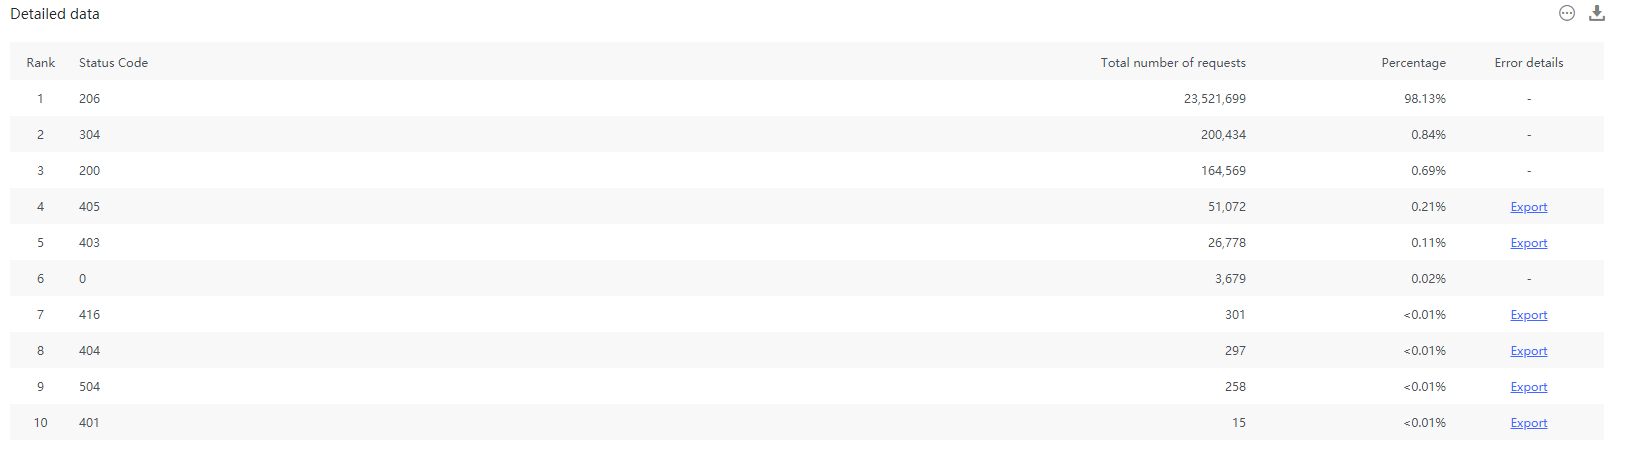
• Detailed Data
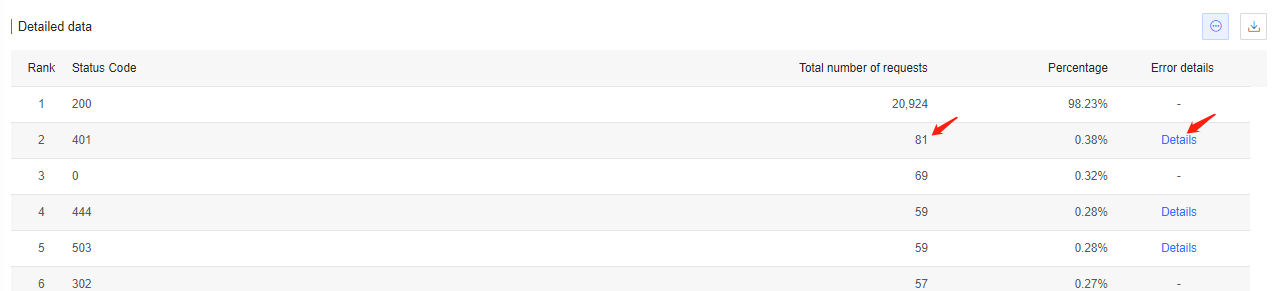
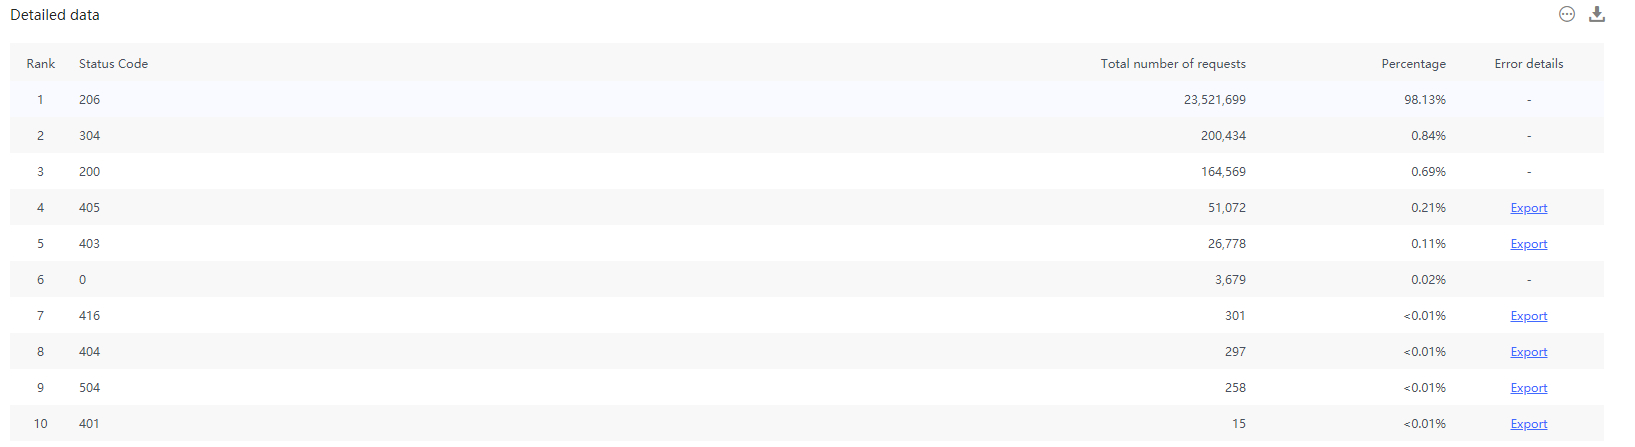
Detailed data reveals the total request number of dissimilar types of status codes, as well as their percentage and error details accordingly. Thereinto, error details contain target URL, origin URL and request. You can export both information of the table, or error details in daily data.
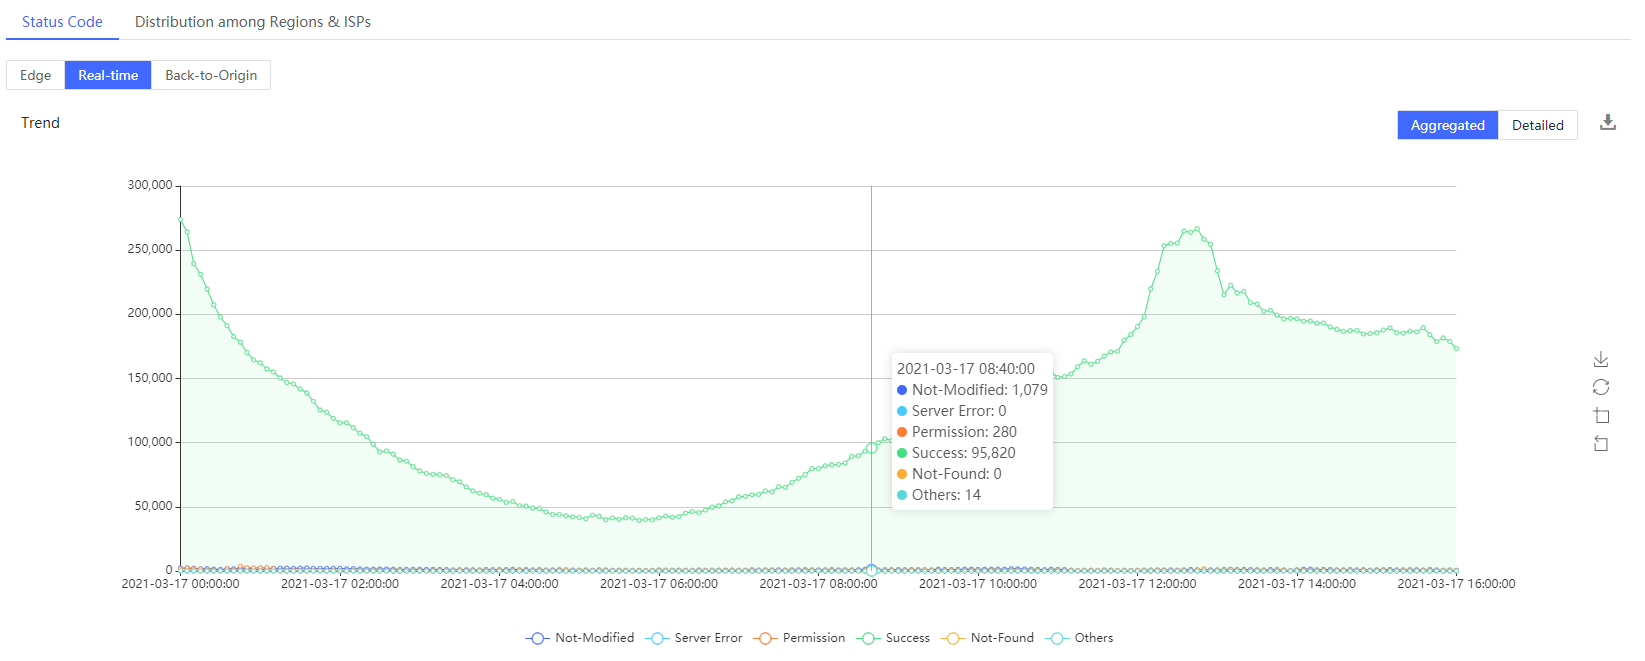
2 Real-time (Edge Status Code)
• Trend
There are two kinds of trend chart, one is aggregation chart, which generates status trend chart by classifying status codes, and the other is detailed status code trend chart. You can switch aggregation chart and detailed chart.The data granularity is in 5-minute level in real-time request, which means the value of every point in the line chart reflects status code data 5 minute before the point.
For example, the value of 00:05:00 is the aggregate status codes generated from 00:00:00 to 00:04:59. The difference between edge request and real-time request is there is less delay in real-time request statistics.
• Detailed Data
Detailed data shows that, during the given time, how many requests of status code types are received and their percentage to all requests.
3 Back-to-Origin (Origin Status code)
• Trend
There are two kinds of trend chart, one is aggregation chart, which generates status trend chart by classifying status codes, and the other is a detailed status code trend chart. You can switch aggregation chart and detailed chart.
The data granularity is in 5-minute level in origin request, which means the value of every point in the line chart reflects status code data 5 minutes before the point.
For example, the value of 00:05:00 is the aggregate status codes generated from 00:00:00 to 00:04:59.
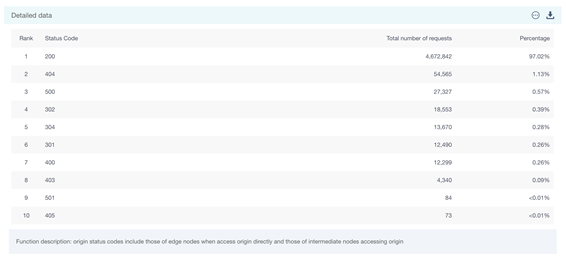
• Detailed Data
Detailed data shows that, during the given time, how many requests of status code types are received and their percentage to all origin requests.
origin status codes include those of edge nodes when access origin directly and those of intermediate nodes(relay) accessing origin
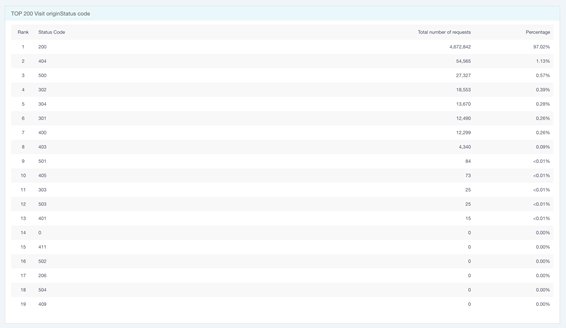
• TOP 200 Visitor originStatus code
TOP 200 Visitor originStatus Code shows that, during the given time, how many requests of status code types are received and their percentage to all origin requests.
Notice about data difference
When comparing the total requests in Detailed Data and Error Details, you may find the total request is different. Reason is that on Detailed Data, requests from all URLs are calculated, while on Error Details table, only requests of TOP 500 URLs are calculated. For example, if 800 URLs has error code 401, in Detailed Data, all requests from 800URL are calculated while in Error Details, we only calculate requests from TOP 500URLS, and for each URL, only TOP 300 referrers are calculated.
The detail error data on Console is only for reference, if you need detail data of all requests, please download log from “Log Download” page and summerize by yourself.