Dashboard
更新时间:2022-06-24 15:42:24
• Entrance
Product → Statistical Analysis → Usage Statistics
• Introduction
The dashboard provides you a summary of usage information of specific domains in specific acceleration areas during a specific period of time.
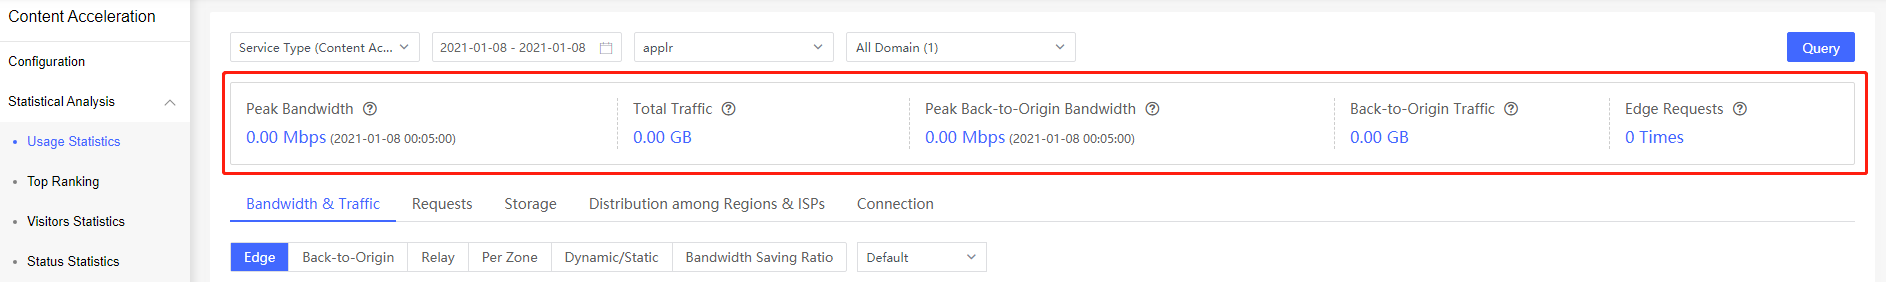
Elements of the dashboard are illustrated as follows:
| Element | Illustration |
|---|---|
| Peak Bandwidth | Peak bandwidth, which is displayed by the unit of Mbps, shows the maximum bandwidth of query domains in query acceleration areas during the query period. The time when the bandwidth reaches its maximum value is presented with the number of Peak Bandwidth.Bandwidth refers to the maximum number of bytes transferred per second (Mbps), and peak value means the highest value of bandwidth within a certain period of time. |
| Total Traffic | Total traffic (GB) presents the total traffic value according to your query settings. The total number of bytes is generated from websites accessed by all visitors in given time range. |
| Peak Origin Bandwidth | Peak origin bandwidth is the highest origin bandwidth value on the basis of your query. The time when origin bandwidth achieves its maximum value is presented aside. Origin bandwidth includes both the back-to-origin bandwidth generated directly from edge nodes and the back-to-origin bandwidth generated from the intermediate nodes. |
| Origin Traffic | In the light of user’s query, the column shows the origin traffic that includes both the back-to-origin traffic generated directly from edge nodes and the back-to-origin traffic generated from intermediate nodes. |
| Edge Requests | In the light of user’s query, the column shows the Edge Request that is the gross request made by query domains to edge servers during the given time. |
In addition, you can also put mouse on the question mark icon besides each element to activate a floating window for checking corresponding definition when using Usage Statistics dashboard.
本篇文档内容对您是否有帮助?
有帮助
我要反馈